Ministry of Commerce: 60-70% of market products are locally made
| News Highlights |
Economy and Industry
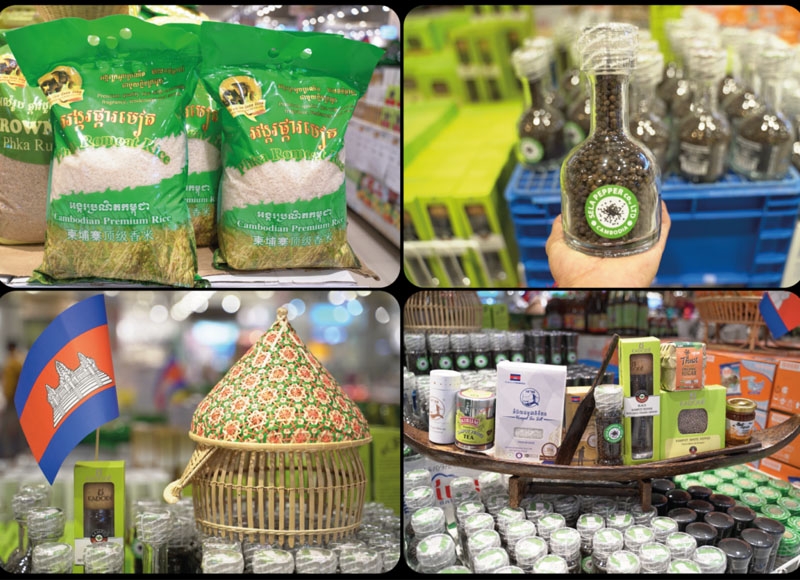
Ministry of Commerce: 60-70% of market products are locally made Cambodia's Royal Government is focused on enhancing the domestic market by promoting local products and reducing reliance on imports, especially from Thailand. Following a halt in imports from Thailand, Cambodian goods now make up 60-70% of the domestic market, with imports coming predominantly from Vietnam, Malaysia, and Indonesia instead. Secretary of State Penn Sovicheat emphasized the importance of supporting local producers and ensuring food quality and safety. Socio-economic researcher Chey Tech highlighted the opportunity for Cambodia to leverage this shift by bolstering local production and redirecting exports to ASEAN markets and beyond. He urged local producers and investors to improve production capacity and maintain reasonable prices to encourage consumer support for Cambodian goods. (Source: Khmer Times)
$4M funding boost for Cambodia's emission reduction initiative at COP30 Cambodia secured a $4 million funding commitment during COP30 in Brazil to implement a black carbon reduction project, supported by the UN and international partners. This investment aims to phase out fossil fuels in favor of clean energy, aligning with the Paris Agreement. Minister of Environment Eang Sophalleth announced additional UN backing for five major environmental projects, including the Tonle Sap Lake Sustainability Programme and initiatives for eco-tourism and crab conservation. The conference emphasized the need to advance climate finance, targeting $1.3 trillion annually by 2035, and Cambodia aims to reduce greenhouse gas emissions by 55% by 2035 across several sectors. (Source: Kiripost)
$276M in new investments approved across 19 Projects by Promotion Working Group The Preah Sihanouk Province Investment Promotion Working Group has approved 19 new investment projects totaling $276 million, expected to create approximately 1,845 jobs. The meeting, led by Hean Sahib at the Ministry of Economy and Finance, reviewed proposals for incentives and support for these investments, which include hotels, mixed-use buildings, and manufacturing plants. Since 2024, the taskforce has approved 392 projects worth $7.871 billion, generating around 50,670 jobs. Key strategies for investment promotion include tax incentives, administrative facilitation, quality investment promotion, local workforce engagement, and the use of domestic resources. Investors are encouraged to apply for these benefits. (Source: Khmer Times)
Corporate News
Canadia Bank teams up with TADA Cambodia to support drivers and boost cashless payments Canadia Bank has partnered with TADA Cambodia to enhance digital payment adoption, expand financial inclusion, promote electric vehicle (EV) use, and improve safety for drivers. This collaboration will introduce cashless payment solutions for TADA drivers and provide EV transportation for Canadia Bank staff. The initiative aims to support Cambodia's vision of a cashless economy and net-zero emissions. Both leaders, Canadia Bank's CEO Dominic Notario and TADA's Country Manager Ty Limkosal, emphasized the partnership's commitment to creating a safer and smarter mobility and payment ecosystem. TADA is also launching exclusive promotions to celebrate this collaboration. (Source: Cambodia Investment Review)
Stock Market
CSX declines 0.18% amid mixed trading activity On 25 November 2025, the CSX Index fell 0.18% to close at 412.6 points. On the Main Board, GTI (+0.28%) and PPAP (+0.15%) recorded gains, while PPSP (-0.48%), CGSM (-0.40%), and PEPC (-0.37%) posted losses. PWSA, PAS, ABC, and MJQE remained unchanged. On the Growth Board, DBDE declined 0.47% and JSL increased 0.37%. Total trading volume reached 53,782 shares, with a turnover of KHR 231 million. (Source: YSC Research)
| CSX Stocks |
CSX Index
| Value | 1D % Chg | 1D Vol | Mkt Cap (KHR'bn) |
| 412.64 | -0.18 | 53,782 | 11,068 |
Stock Performance
| Stock | Close (KHR) | 1D chg (%) | MTD chg (%) | YTD chg (%) | 1M high (KHR) | 1M low (KHR) | MTD vol (shr) | Mkt cap (KHR'bn) |
| PWSA | 6,220 | 0.00 | 0.97 | -2.20 | 6,220 | 6,140 | 45,682 | 541 |
| GTI | 7,040 | 0.28 | -0.28 | 38.58 | 7,100 | 6,920 | 46,550 | 282 |
| PPAP | 13,760 | 0.15 | 1.78 | -0.58 | 13,800 | 6,220 | 7,754 | 285 |
| PPSP | 2,080 | -0.48 | 1.46 | -4.15 | 2,100 | 2,030 | 343,053 | 150 |
| PAS | 12,340 | 0.00 | 1.65 | 6.75 | 12,360 | 12,100 | 6,179 | 1,058 |
| ABC | 7,000 | 0.00 | 3.55 | -7.16 | 7,180 | 6,760 | 558,434 | 3,032 |
| PEPC | 2,670 | -0.37 | 6.37 | 10.33 | 2,680 | 2,500 | 2,288 | 200 |
| MJQE | 1,980 | 0.00 | 0.00 | -4.81 | 1,980 | 1,970 | 135,007 | 642 |
| CGSM | 2,490 | -0.40 | 1.22 | 2.47 | 6,220 | 2,440 | 55,689 | 4,879 |
| DBDE | 2,130 | -0.47 | 5.45 | 3.40 | 2,180 | 2,010 | 30,692 | 39 |
| JSL | 2,690 | 0.37 | -3.58 | -21.35 | 2,840 | 2,680 | 16,243 | 69 |
| 1D = 1 Day; 1M= 1 Month; MTD = Month-To-Date; YTD = Year-To-Date; Chg = Change; Vol = Volume; shr = share; Mkt cap = Market capitalization | ||||||||
Valuation Ratios
| EPS | BPS* | P/E | P/B | P/S | EV/EBITDA | ||
| ttm,mrq | (ttm,KHR) | KHR | (ttm,x) | (mrq,x) | (ttm,x) | (ttm,x) | |
| PPWSA | 2Q25 | 827 | 11,622 | 7.52 | 0.54 | 1.70 | 14.89 |
| GTI | 2Q25 | 29 | 7,023 | 241.59 | 1.00 | 0.86 | 39.69 |
| PPAP | 1Q25 | 2,951 | 22,115 | 4.66 | 0.62 | 1.60 | 4.01 |
| PPSP | 2Q25 | 735 | 4,376 | 2.83 | 0.48 | 0.95 | 2.11 |
| PAS | 1Q25 | 1,212 | 8,224 | 10.18 | 1.50 | 2.22 | 7.77 |
| ABC | 2Q25 | 1,460 | 14,410 | 4.79 | 0.49 | 0.84 | NA |
| PEPC* | 3Q25 | -1,445 | -1,303 | NA | NA | 3.20 | NA |
| MJQE | 2Q25 | 45 | 340 | 43.83 | 5.82 | 3.87 | 12.70 |
| CGSM | 2Q25 | 25 | 618 | 101.35 | 4.03 | 7.11 | 19.70 |
| JSL | 2Q25 | -82 | 492 | NA | 5.46 | 19.91 | 33.71 |
| DBDE | 2Q25 | 147 | 1,933 | 14.53 | 1.10 | 0.33 | 7.44 |
| NOTE: ttm= trailing-twelve months; mrq = most recent quarter; *FY ending in June, **excluding non-voting shares | |||||||
| Corporate Bonds |
Trading Summary
| Bond Symbol | Trading Vol (Units) | Trading Val (KHR'mn) | Latest Yield | Credit Rating | Bond Feature | Coupon Rate (%) | Days to Maturity |
| ABC32A | 0 | 0.0 | - - | khAA | Subordinated Bond | 8.50% | 2,250 |
| ABC32B | 0 | 0.0 | - - | KhAA | Subordinated Bond | 8.50% | 2,292 |
| ABC32C | 0 | 0.0 | - - | khAA | Subordinated Bond | 7.50% p.a. | 2,483 |
| CGSM33A | 0 | 0.0 | - - | KhAAA | Sustainability Bond | SOFR +3% or 5.5% per annum, whichever is higher | 2,912 |
| CIAF28A | 0 | 0.0 | - - | KhAAA | N/A | 6.30% Annually | 1,116 |
| CIAF30A | 0 | 0.0 | - - | KhAAA | Guaranteed Bond | 5.60% | 1,563 |
| GT27A | 0 | 0.0 | - - | N/A | Plain Bond, Green Bond | 7% per annum | 741 |
| PPSP29A | 0 | 0.0 | - - | KhAAA | Guaranteed Green Bond | Term SOFR + 1.5% | 1,303 |
| RRC32A | 0 | 0.0 | - - | N/A | Plain Bond | 7% Annually | 2,511 |
| RRGO27A | 0 | 0.0 | - - | KhAAA | Guaranteed Bond | SOFR+3,5% or 5% per annum (take which one is higher) | 758 |
| RRGT32B | 0 | 0.0 | - - | KhAAA | Guaranteed Bond | SOFR+3,5% or 5% per annum (take which one is higher) and Year 6 to Year 10: SOFR+3,75% or 5% per annum (take which one is higher) | 2,585 |
| SNTD40A | 0 | 0.0 | - - | N/A | Green Infrastructure Bond | 180-Day SOFR Average + 1.80% | 5,237 |
| SNTD40B | 0 | 0.0 | - - | N/A | Green Infrastructure Bond | 180-Day Average SOFR + 1.60% (4.00% - 6.00%) | 5,237 |
| Government Bonds |
Historical Issuance Summary
| 1 Y | 2 Y | 3 Y | 5 Y | 10 Y | |
| Total issuance ('K units) | 238.1 | 312.0 | 384.8 | 18.0 | 0.0 |
| Outstanding (KHR'bn) | 58.0 | 180.0 | 384.8 | 18.0 | 0.0 |
| Issuance ('K units, Latest) | 34.0 | 0.0 | 157.5 | 8.0 | 0.0 |
| Coupon rate (Latest) | 2.70% | 3.20% | 3.40% | 4.34% | 4.60% |
| Successful yield (Latest) | 3.25% | - | 3.90% | 5.00% | - |
| Latest bidding | 23-Apr-25 | 21-May-25 | 22-Oct-25 | 45,861 | 45,889 |
| *Total issuance is the accumulated issuance since September 2022; **Outstanding is aggregate principal value of government that remain outstanding; ***Successful yield: mid yields are shown if multiple price auction method was adopted. | |||||
| Stock Charts |
Main Board
Growth Board