Cambodia's industrial sector expected to grow 7.1% in 2026
| News Highlights |
Economy and Industry
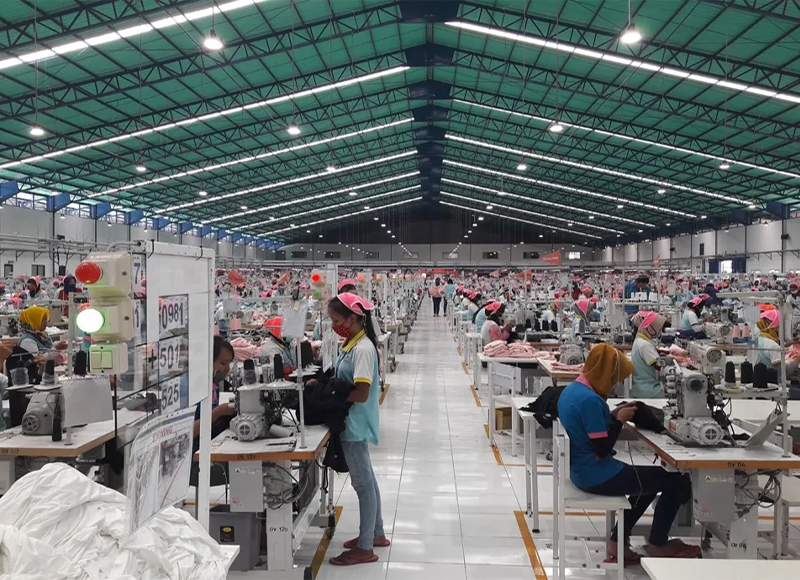
Cambodia's industrial sector expected to grow 7.1% in 2026 Cambodia's industrial sector is projected to grow by 7.1% in 2026, slightly slower than the 7.8% expected in 2025. This growth, supported by resilience in key sub-sectors like food and beverage manufacturing, is impacted by a slowdown in garment and non-garment manufacturing due to global economic uncertainties and tariff challenges. The Ministry of Economy and Finance forecasts an average growth rate of 7.4% from 2026 to 2028, with ongoing demand from the EU and ASEAN markets aiding the garment sector's recovery. Significant government initiatives aim to enhance competitiveness and support small to medium-sized enterprises (SMEs). However, reliance on exports, particularly to the US, poses risks, necessitating efforts to diversify and strengthen domestic production and consumption to stabilize the economy against external pressures. (Source: Khmer Times)
WFP reports conflict behind rising food price instability in border areas Recent monitoring by the World Food Programme (WFP) indicates that markets along the Cambodia-Thailand border, despite ongoing conflicts, maintain functionality and essential goods availability. However, volatility in Basic Food Basket (BFB) costs has been noted, with significant regional disparities driven by local market pressures and broader disruptions. The Market Functionality Index (MFI) suggests recovery in demand is ongoing, with improvements in October 2025. Average BFB costs across five provinces (Preah Vihear, Oddar Meanchey, Banteay Meanchey, Battambang, and Pursat) decreased from March to October 2025 compared to 2024, although this does not imply better affordability due to diminished consumer activity and market disruptions during border tensions. Preah Vihear reported the highest costs, whereas Battambang and others experienced stability. The uneven effects of border tensions underline the need for tailored monitoring and interventions. Despite challenges, market resilience mitigated price shocks, particularly after bilateral agreements resumed trade and household displacements back to homes, enhancing demand and trader confidence. (Source: Khmer Times)
Exports to the EU experience strong growth Cambodia's exports to the European Union (EU) reached $4,215 million from January to October 2025, marking a 17.32% increase from the previous year. This growth reflects the competitiveness of Cambodian goods, particularly in key sectors like clothing and footwear, aided by favorable trade agreements such as the Everything But Arms (EBA) scheme. The EU represented 16.28% of Cambodia's total exports. Major trade partners include Spain, Germany, and the Netherlands. Imports from the EU fell by 8.76% to $737 million, yet overall two-way trade increased by 12.53% to $4,953 million. Recent dialogues have emphasized opportunities in manufacturing and digital transformation within Cambodia's evolving market landscape. (Source: Khmer Times)
Corporate News
Starbucks commemorates 10-year milestone in Cambodia Starbucks celebrated its 10th anniversary in Cambodia, marking a decade of growth and community impact since its inception in 2015. Currently, it operates 57 stores across 8 cities, engaging over 500 partners. CEO Brian Niccol emphasized the importance of local partnerships and cultural integration in Starbucks' success. The company has elevated Cambodia's cafe culture by offering high-quality, handcrafted beverages, recently opening its 50th store, which celebrates Khmer architecture and culture. Additionally, Starbucks Cambodia focuses on partner development and community service, collaborating with non-profits to support education, vocational training, and access to clean water. The company's commitment to sustainability is reflected in its Greener Store initiatives. Overall, Starbucks' presence in Cambodia symbolizes a blend of global brand philosophy with local community values. (Source: The Phnom Penh Post)
Stock Market
CSX rises 0.19% amid mixed main board performance On 21 November 2025, the CSX Index rose 0.19% to close at 414.6 points. On the Main Board, PPSP (+0.48%), CGSM (+0.40%), and ABC (+0.28%) recorded gains, while GTI (-1.70%) and PAS (-0.32%) posted losses. PWSA, PPAP, PEPC, and MJQE remained unchanged. On the Growth Board, DBDE increased 0.47%, while JSL decreased 0.74%. Total trading volume reached 31,359 shares, with a turnover of KHR 119 million. (Source: YSC Research)
| CSX Stocks |
CSX Index
| Value | 1D % Chg | 1D Vol | Mkt Cap (KHR'bn) |
| 414.56 | 0.19 | 31,359 | 11,119 |
Stock Performance
| Stock | Close (KHR) | 1D chg (%) | MTD chg (%) | YTD chg (%) | 1M high (KHR) | 1M low (KHR) | MTD vol (shr) | Mkt cap (KHR'bn) |
| PWSA | 6,220 | 0.00 | 0.97 | -2.20 | 6,220 | 6,140 | 40,522 | 541 |
| GTI | 6,920 | -1.70 | -1.98 | 36.22 | 7,100 | 6,920 | 41,338 | 277 |
| PPAP | 13,760 | 0.00 | 1.78 | -0.58 | 13,800 | 6,220 | 7,518 | 285 |
| PPSP | 2,100 | 0.48 | 2.44 | -3.23 | 2,100 | 2,030 | 301,030 | 151 |
| PAS | 12,320 | -0.32 | 1.48 | 6.57 | 12,360 | 12,100 | 5,164 | 1,057 |
| ABC | 7,040 | 0.28 | 4.14 | -6.63 | 7,180 | 6,740 | 528,492 | 3,049 |
| PEPC | 2,670 | 0.00 | 6.37 | 10.33 | 2,670 | 2,500 | 1,828 | 200 |
| MJQE | 1,980 | 0.00 | 0.00 | -4.81 | 1,980 | 1,960 | 112,034 | 642 |
| CGSM | 2,510 | 0.40 | 2.03 | 3.29 | 6,220 | 2,430 | 47,702 | 4,918 |
| DBDE | 2,140 | 0.47 | 5.94 | 3.88 | 2,180 | 2,000 | 20,973 | 40 |
| JSL | 2,680 | -0.74 | -3.94 | -21.64 | 2,840 | 2,680 | 11,844 | 69 |
| 1D = 1 Day; 1M= 1 Month; MTD = Month-To-Date; YTD = Year-To-Date; Chg = Change; Vol = Volume; shr = share; Mkt cap = Market capitalization | ||||||||
Valuation Ratios
| EPS | BPS* | P/E | P/B | P/S | EV/EBITDA | ||
| ttm,mrq | (ttm,KHR) | KHR | (ttm,x) | (mrq,x) | (ttm,x) | (ttm,x) | |
| PPWSA | 2Q25 | 827 | 11,622 | 7.52 | 0.54 | 1.70 | 14.89 |
| GTI | 2Q25 | 29 | 7,023 | 237.47 | 0.99 | 0.84 | 39.20 |
| PPAP | 1Q25 | 2,951 | 22,115 | 4.66 | 0.62 | 1.60 | 4.01 |
| PPSP | 2Q25 | 735 | 4,376 | 2.86 | 0.48 | 0.96 | 2.13 |
| PAS | 1Q25 | 1,212 | 8,224 | 10.17 | 1.50 | 2.22 | 7.77 |
| ABC | 2Q25 | 1,460 | 14,410 | 4.82 | 0.49 | 0.84 | NA |
| PEPC* | 3Q25 | -1,445 | -1,303 | NA | NA | 3.20 | NA |
| MJQE | 2Q25 | 45 | 340 | 43.83 | 5.82 | 3.87 | 12.70 |
| CGSM | 2Q25 | 25 | 618 | 102.17 | 4.06 | 7.17 | 19.84 |
| JSL | 2Q25 | -82 | 492 | NA | 5.44 | 19.83 | 33.63 |
| DBDE | 2Q25 | 147 | 1,933 | 14.60 | 1.11 | 0.33 | 7.46 |
| NOTE: ttm= trailing-twelve months; mrq = most recent quarter; *FY ending in June, **excluding non-voting shares | |||||||
| Corporate Bonds |
Trading Summary
| Bond Symbol | Trading Vol (Units) | Trading Val (KHR'mn) | Latest Yield | Credit Rating | Bond Feature | Coupon Rate (%) | Days to Maturity |
| ABC32A | 0 | 0.0 | - - | khAA | Subordinated Bond | 8.50% | 2,254 |
| ABC32B | 0 | 0.0 | - - | KhAA | Subordinated Bond | 8.50% | 2,296 |
| ABC32C | 0 | 0.0 | - - | khAA | Subordinated Bond | 7.50% p.a. | 2,487 |
| CGSM33A | 0 | 0.0 | - - | KhAAA | Sustainability Bond | SOFR +3% or 5.5% per annum, whichever is higher | 2,916 |
| CIAF28A | 0 | 0.0 | - - | KhAAA | N/A | 6.30% Annually | 1,120 |
| CIAF30A | 0 | 0.0 | - - | KhAAA | Guaranteed Bond | 5.60% | 1,567 |
| GT27A | 0 | 0.0 | - - | N/A | Plain Bond, Green Bond | 7% per annum | 745 |
| PPSP29A | 0 | 0.0 | - - | KhAAA | Guaranteed Green Bond | Term SOFR + 1.5% | 1,307 |
| RRC32A | 0 | 0.0 | - - | N/A | Plain Bond | 7% Annually | 2,515 |
| RRGO27A | 0 | 0.0 | - - | KhAAA | Guaranteed Bond | SOFR+3,5% or 5% per annum (take which one is higher) | 762 |
| RRGT32B | 0 | 0.0 | - - | KhAAA | Guaranteed Bond | SOFR+3,5% or 5% per annum (take which one is higher) and Year 6 to Year 10: SOFR+3,75% or 5% per annum (take which one is higher) | 2,589 |
| SNTD40A | 0 | 0.0 | - - | N/A | Green Infrastructure Bond | 180-Day SOFR Average + 1.80% | 5,241 |
| SNTD40B | 0 | 0.0 | - - | N/A | Green Infrastructure Bond | 180-Day Average SOFR + 1.60% (4.00% - 6.00%) | 5,241 |
| Government Bonds |
Historical Issuance Summary
| 1 Y | 2 Y | 3 Y | 5 Y | 10 Y | |
| Total issuance ('K units) | 238.1 | 312.0 | 384.8 | 18.0 | 0.0 |
| Outstanding (KHR'bn) | 58.0 | 208.0 | 384.8 | 18.0 | 0.0 |
| Issuance ('K units, Latest) | 34.0 | 0.0 | 157.5 | 8.0 | 0.0 |
| Coupon rate (Latest) | 2.70% | 3.20% | 3.40% | 4.34% | 4.60% |
| Successful yield (Latest) | 3.25% | - | 3.90% | 5.00% | - |
| Latest bidding | 23-Apr-25 | 21-May-25 | 22-Oct-25 | 45,861 | 45,889 |
| *Total issuance is the accumulated issuance since September 2022; **Outstanding is aggregate principal value of government that remain outstanding; ***Successful yield: mid yields are shown if multiple price auction method was adopted. | |||||
| Stock Charts |
Main Board
Growth Board