ADB approves $82.5 million to boost Cambodia's energy transition
| News Highlights |
Economy and Industry
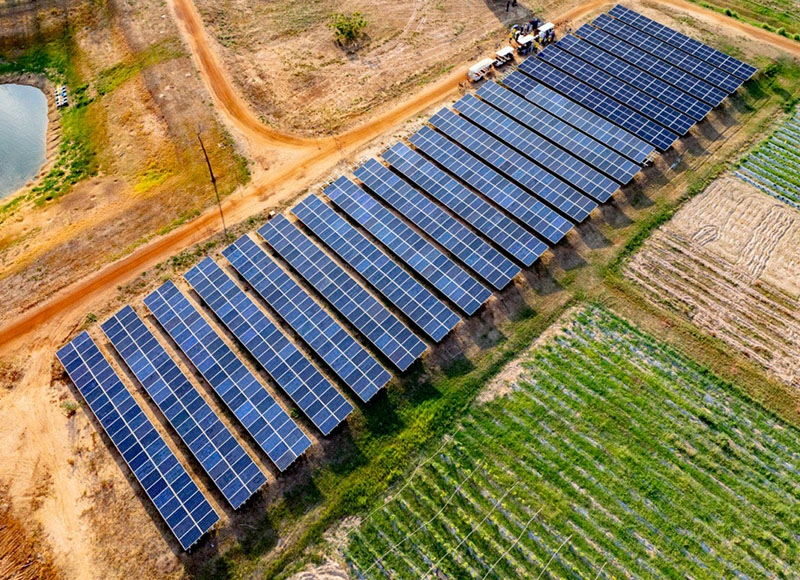
ADB approves $82.5 million to boost Cambodia's energy transition The Asian Development Bank (ADB) has approved $82.5 million for the second phase of Cambodia's Energy Transition Sector Development Program (ETSDP), aimed at promoting a clean energy shift through policy reform and innovative technology investments. This funding, cofinanced by various international and regional entities, builds on earlier reforms from the first phase in 2022. Subprogram 2 will enhance energy efficiency regulations and introduce Minimum Energy Performance Standards (MEPS) for appliances, starting with air conditioners. It will also establish an Energy Efficiency Revolving Fund to improve access to finance for small and medium enterprises (SMEs) investing in energy-saving technologies. ADB emphasizes the significance of these efforts in supporting Cambodia's goal of reaching 70% renewable energy in the power mix by 2030 and improving energy efficiency for sustainable growth. A planned third subprogram in 2027 will continue these efforts by expanding regulatory frameworks and technical standards. (Source: The Phnom Penh Post)
Cambodia's Tourism Ministry reports 38% drop in visitor arrivals in August In August, Cambodia reported a significant decline in international tourist arrivals, with 338,351 visitors, a 38.4% decrease from 2024. The largest share came from China (97,456 visitors, up 30.2%), while Vietnam saw a decline (93,857 visitors, down 15.5%) and Thailand experienced a dramatic drop to 16,137 visitors (down 91.6%). For the first eight months, Cambodia welcomed 4.05 million international visitors, a 5.6% decrease from the previous year. Geopolitical tensions, especially border conflicts with Thailand, have adversely affected tourism, as noted by Chhay Sivlin, President of the Cambodia Association of Travel Agents (CATA). However, Chinese tourism remains strong, contributing positively to Cambodia's tourism sector. (Source: Khmer Times)
Insurance premiums exceed $35 million in August The Cambodian insurance market shows significant potential for further growth, as indicated by its total gross premium reaching $35.2 million in August, a 9.24% increase from the previous year. Life insurance premiums grew by 4.23% to $19.6 million, while general insurance saw a larger increase of 16.28% to $15.5 million. Despite the growth in premiums, the total claims paid out decreased by 57.6% to $9.7 million. Bou Chanphirou, Director General of the Insurance Regulator of Cambodia (IRC), emphasized the improvements in governance and the need for increased insurance penetration and density. The IRC is dedicated to strengthening the insurance sector through education, building public trust, and ensuring legal clarity for consumers. Furthermore, the regulatory body is focused on aligning its practices with regional and global standards, enhancing the stability and resilience of the insurance market. Cambodia currently has 59 licensed insurance operators across various categories, including general, life, and micro-insurance providers. (Source: Khmer Times)
Corporate News
DICHI Academy and CamTech partner to advance digital skills development in Cambodia DICHI Academy and Cambodia University of Technology and Science (CamTech) have signed a Memorandum of Understanding to enhance digital education, research collaboration, and workforce development in Cambodia. This partnership aims to prepare students and professionals for the digital economy by developing training programs in data science, software development, artificial intelligence, and digital innovation. Both institutions will design up-to-date curricula, mentorship programs, and hands-on experiences to equip learners with relevant skills for the growing technology sector. This collaboration is set to strengthen Cambodia's skilled workforce and ultimately drive innovation and economic growth. (Source: Cambodia Investment Review)
Stock Market
CSX index rises 0.08% on October 7 On 7 October 2025, the CSX Index rose 0.08% to close at 402.9 points. On the Main Board, GTI (+0.85%) and CGSM (+0.41%) posted gains, while PPSP (-0.49%), PEPC (-0.39%), PWSA (-0.32%), ABC (-0.29%), and PAS (-0.17%) recorded losses. PPAP closed unchanged. On the Growth Board, DBDE was unchanged, while JSL fell 0.36%. Total trading volume reached 41,382 shares, with a turnover of KHR 219 million. (Source: YSC Research)
| CSX Stocks |
CSX Index
| Value | 1D % Chg | 1D Vol | Mkt Cap (KHR'bn) |
| 402.91 | 0.08 | 41,382 | 10,806 |
Stock Performance
| Stock | Close (KHR) | 1D chg (%) | MTD chg (%) | YTD chg (%) | 1M high (KHR) | 1M low (KHR) | MTD vol (shr) | Mkt cap (KHR'bn) |
| PWSA | 6,140 | -0.32 | -0.32 | -3.46 | 6,220 | 6,140 | 20,047 | 534 |
| GTI | 7,100 | 0.85 | 0.00 | 39.76 | 7,140 | 6,900 | 4,147 | 284 |
| PPAP | 13,600 | 0.00 | 0.15 | -1.73 | 13,600 | 13,500 | 809 | 281 |
| PPSP | 2,050 | -0.49 | -0.49 | -5.53 | 2,070 | 2,050 | 18,848 | 147 |
| PAS | 12,100 | -0.17 | -0.49 | 4.67 | 12,200 | 12,000 | 2,563 | 1,038 |
| ABC | 6,760 | -0.29 | -0.29 | -10.34 | 6,800 | 6,740 | 100,142 | 2,928 |
| PEPC | 2,550 | -0.39 | -2.30 | 6.69 | 2,680 | 2,530 | 1,601 | 191 |
| MJQE | 1,980 | 0.00 | 0.00 | -4.81 | 1,990 | 1,970 | 43,139 | 642 |
| CGSM | 2,430 | 0.41 | 0.00 | 0.00 | 2,440 | 2,420 | 24,024 | 4,761 |
| DBDE | 2,030 | 0.00 | -0.49 | -1.46 | 2,050 | 2,020 | 7,250 | 37 |
| JSL | 2,740 | -0.36 | -0.72 | -19.88 | 2,900 | 2,740 | 50,502 | 70 |
| 1D = 1 Day; 1M= 1 Month; MTD = Month-To-Date; YTD = Year-To-Date; Chg = Change; Vol = Volume; shr = share; Mkt cap = Market capitalization | ||||||||
Valuation Ratios
| EPS | BPS* | P/E | P/B | P/S | EV/EBITDA | ||
| ttm,mrq | (ttm,KHR) | KHR | (ttm,x) | (mrq,x) | (ttm,x) | (ttm,x) | |
| PPWSA | 2Q25 | 827 | 11,622 | 7.42 | 0.53 | 1.68 | 14.84 |
| GTI | 2Q25 | 29 | 7,023 | 243.65 | 1.01 | 0.86 | 39.93 |
| PPAP | 1Q25 | 2,951 | 22,115 | 4.61 | 0.61 | 1.58 | 3.97 |
| PPSP | 2Q25 | 735 | 4,376 | 2.79 | 0.47 | 0.94 | 2.07 |
| PAS | 1Q25 | 1,212 | 8,224 | 9.98 | 1.47 | 2.18 | 7.67 |
| ABC | 2Q25 | 1,460 | 14,410 | 4.63 | 0.47 | 0.81 | NA |
| PEPC* | 3Q25 | -1,445 | -1,303 | NA | NA | 3.05 | NA |
| MJQE | 2Q25 | 45 | 340 | 43.83 | 5.82 | 3.87 | 12.70 |
| CGSM | 2Q25 | 25 | 618 | 98.91 | 3.93 | 6.94 | 19.28 |
| JSL | 2Q25 | -82 | 492 | NA | 5.56 | 20.28 | 34.07 |
| DBDE | 2Q25 | 147 | 1,933 | 13.85 | 1.05 | 0.31 | 7.19 |
| NOTE: ttm= trailing-twelve months; mrq = most recent quarter; *FY ending in June, **excluding non-voting shares | |||||||
| Corporate Bonds |
Trading Summary
| Bond Symbol | Trading Vol (Units) | Trading Val (KHR'mn) | Latest Yield | Credit Rating | Bond Feature | Coupon Rate (%) | Days to Maturity |
| ABC32A | 0 | 0.0 | - - | khAA | Subordinated Bond | 8.50% | 2,299 |
| ABC32B | 0 | 0.0 | - - | KhAA | Subordinated Bond | 8.50% | 2,341 |
| CGSM33A | 0 | 0.0 | - - | KhAAA | Sustainability Bond | SOFR +3% or 5.5% per annum, whichever is higher | 2,961 |
| CIAF28A | 0 | 0.0 | - - | KhAAA | N/A | 6.30% Annually | 1,165 |
| CIAF30A | 0 | 0.0 | - - | KhAAA | Guaranteed Bond | 5.60% | 1,612 |
| GT27A | 0 | 0.0 | - - | N/A | Plain Bond, Green Bond | 7% per annum | 790 |
| PPSP29A | 0 | 0.0 | - - | KhAAA | Guaranteed Green Bond | Term SOFR + 1.5% | 1,352 |
| RRC32A | 0 | 0.0 | - - | N/A | Plain Bond | 7% Annually | 2,560 |
| RRGO27A | 0 | 0.0 | - - | KhAAA | Guaranteed Bond | SOFR+3,5% or 5% per annum (take which one is higher) | 807 |
| RRGT32B | 0 | 0.0 | - - | KhAAA | Guaranteed Bond | SOFR+3,5% or 5% per annum (take which one is higher) and Year 6 to Year 10: SOFR+3,75% or 5% per annum (take which one is higher) | 2,634 |
| SNTD40A | 0 | 0.0 | - - | N/A | Green Infrastructure Bond | 180-Day SOFR Average + 1.80% | 5,286 |
| SNTD40B | 0 | 0.0 | - - | N/A | Green Infrastructure Bond | 180-Day Average SOFR + 1.60% (4.00% - 6.00%) | 5,286 |
| SNTD40C | 0 | 0.0 | - - | N/A | Green Infrastructure Bond | 180-Day SOFR Average + 3.00% | 5,286 |
| Government Bonds |
Historical Issuance Summary
| 1 Y | 2 Y | 3 Y | 5 Y | 10 Y | |
| Total issuance ('K units) | 238.1 | 312.0 | 227.3 | 18.0 | 0.0 |
| Outstanding (KHR'bn) | 58.0 | 208.0 | 227.3 | 18.0 | 0.0 |
| Issuance ('K units, Latest) | 34.0 | 0.0 | 40.0 | 8.0 | 0.0 |
| Coupon rate (Latest) | 2.70% | 3.20% | 3.50% | 4.34% | 4.60% |
| Successful yield (Latest) | 3.25% | - | 4.30% | 5.00% | - |
| Latest bidding | 23-Apr-25 | 21-May-25 | 17-Sep-25 | 45,861 | 45,889 |
| *Total issuance is the accumulated issuance since September 2022; **Outstanding is aggregate principal value of government that remain outstanding; ***Successful yield: mid yields are shown if multiple price auction method was adopted. | |||||
| Stock Charts |
Main Board
Growth Board