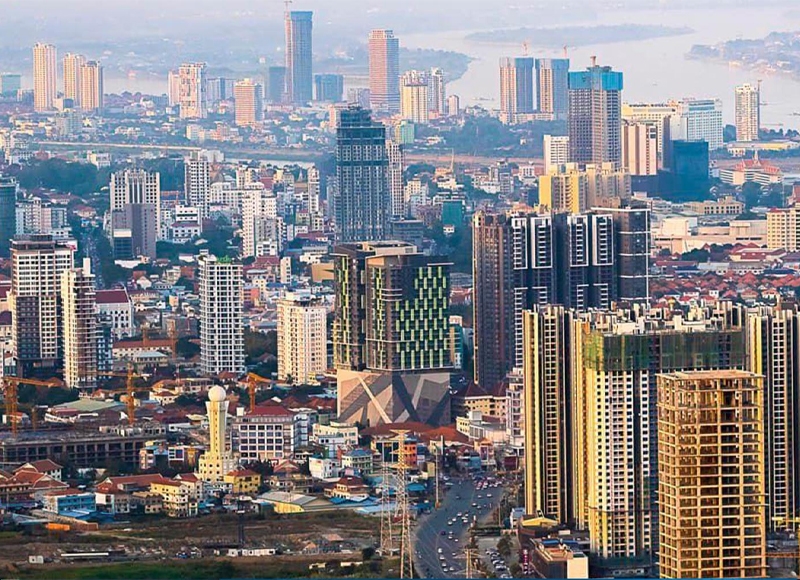
Cambodia's economic growth projection revised to 5.2% by AMRO
| News Highlights |
Economy and Industry
Cambodia's economic growth projection revised to 5.2% by AMRO Cambodia's GDP forecast for 2026 has been revised to 5.2% due to global economic uncertainties influenced by US tariff measures. The World Bank also revised its growth forecast for Cambodia from 5.5% to 4.0%. AMRO estimates that CPI inflation will remain stable at 2.5% in 2025 and 2.3% in 2026. Cambodia and Vietnam are the most exposed to US tariff shocks due to their excess dependence on exports to America. The ASEAN+3 region can integrate more due to Japan, South Korea, and China's technological advancements. Cambodia's recent tariff cut from 49% to 36% represents a policy win, reducing trade distortion, increasing competition, and stimulating downstream industries. Economist Darin Duch believes Cambodia can decrease its tariffs further as it engages in bilateral trade negotiations, boosting investor confidence and encouraging economic diversification for long-term sustainability. (Source: Khmer Times)
MoU signed between Cambodia and Korea to advance eco-friendly transport A memorandum of understanding (MoU) was signed between Cambodia and South Korea to enhance green transport in the Kingdom, in line with Korea's international carbon reduction initiative under the Paris Agreement. The MoU was signed between Chhoun Won, Director General of the General Department of Land Transport, and Peob-Min Ryu, Director General of the Ministry of Trade, Industry and Energy of Korea. South Korea aims to implement a project that will cut 680,000 tonnes of carbon emissions in the Kingdom. As per the Paris Agreement, a host country can sell globally transferred mitigation outcomes, or carbon credits, to a buyer country in exchange for investments, support for carbon reduction capacity building, and access to related technologies. South Korea will transfer 400,000 tonnes of projected carbon reductions to South Korea, which has pledged to reduce its greenhouse gas emissions by 40% from 2018 levels by 2030 and achieve carbon neutrality by 2050. (Source: Khmer Times)
Fresh mango exports decline by 7.14% YoY amid rising domestic demand Cambodia's fresh mango exports fell by 7.14% YoY in the first half of 2025, largely due to increased local demand. Experts attribute this to the ban on Thai fruit and vegetables and an increase in dried mango exports. Fresh mango exports fell by 7.14% YoY to 176,909.33 tonnes, while dried mango exports rose by 19.26 percent compared to the same period in 2024. In 2024, Cambodia sold over $140 million of fresh mangoes to other countries, a 24% YoY increase, with many going to China. Socio-economic analyst Chey Tech noted that mangos are a key product in Cambodia's business and economic operations. However, some mango processing factories have been suspended by authorities due to non-compliance with environmental laws. The Coalition of Cambodian Farmer Community President, Theng Savoeun, attributed the increase in domestic demand for fresh mangoes to the ongoing tensions between Cambodia and Thailand and the ban on Thai goods. (Source: Kiripost)
Corporate News
CGCC and Sathapana Bank partner to boost Cambodian business growth with guarantee schemes Credit Guarantee Corporation of Cambodia (CGCC) and Sathapana Bank have announced a partnership on the Wholesale Guarantee Scheme (WGS) and Economic Stimulus Guarantee Scheme (ESGS). These initiatives aim to improve access to finance for businesses in Cambodia, particularly for Micro, Small, and Medium Enterprises (MSMEs) and larger firms for expansion and operational resilience. The partnership is crucial for driving economic growth, ensuring that businesses, regardless of size or collateral capacity, have the financial support needed to thrive and contribute to the country's economic landscape. The WGS and ESGS will support Sathapana Bank in managing risk exposure and enabling them to lend more to potential small and medium-sized enterprises during economic uncertainty. The partnership will also unleash the entrepreneurial potential of Cambodians, allowing them to extend their credit lines through nationwide networks to a broader segment of the market. The lending aligns with Cambodia's national development priorities, fostering growth in areas crucial to long-term prosperity and improving livelihoods for Cambodian families. (Source: Cambodia Investment Review)
Stock Market
CSX index drops 0.21% despite gains in PEPC and GTI On 24 July 2025, the CSX Index edged down by 0.21%, closing at 404.6 points. On the Main Board, PEPC (+2.26%), GTI (+1.33%), and PPAP (+0.30%) posted gains, while PAS (-0.99%), ABC (-0.58%), MJQE (-0.50%), and PPSP (-0.47%) recorded losses. PWSA and CGSM remained unchanged. On the Growth Board, both DBDE and JSL were also unchanged. Total trading volume reached 86,750 shares, with a turnover of KHR 432 million. (Source: YSC Research)
| CSX Stocks |
CSX Index
| Value | 1D % Chg | 1D Vol | Mkt Cap (KHR'bn) |
| 404.55 | -0.21 | 86,750 | 10,850 |
Stock Performance
| Stock | Close (KHR) | 1D chg (%) | MTD chg (%) | YTD chg (%) | 1M high (KHR) | 1M low (KHR) | MTD vol (shr) | Mkt cap (KHR'bn) |
| PWSA | 6,200 | 0.00 | -4.32 | -2.52 | 6,580 | 6,200 | 162,470 | 539 |
| GTI | 6,080 | 1.33 | -6.46 | 19.69 | 6,920 | 5,860 | 129,815 | 243 |
| PPAP | 13,540 | 0.30 | -0.29 | -2.17 | 13,620 | 13,320 | 9,211 | 280 |
| PPSP | 2,110 | -0.47 | 0.00 | -2.76 | 2,120 | 2,100 | 119,927 | 152 |
| PAS | 11,980 | -0.99 | -3.07 | 3.63 | 12,360 | 11,880 | 53,207 | 1,028 |
| ABC | 6,880 | -0.58 | -0.58 | -8.75 | 6,960 | 6,860 | 340,997 | 2,980 |
| PEPC | 2,710 | 2.26 | 3.04 | 13.39 | 2,710 | 2,560 | 3,181 | 203 |
| MJQE | 1,990 | -0.50 | -1.00 | -4.33 | 2,030 | 1,990 | 402,935 | 645 |
| CGSM | 2,440 | 0.00 | 0.41 | 0.41 | 2,440 | 2,420 | 74,807 | 4,781 |
| DBDE | 2,020 | 0.00 | -1.46 | -1.94 | 2,050 | 2,020 | 20,929 | 37 |
| JSL | 2,790 | 0.00 | 1.09 | -18.42 | 2,880 | 2,690 | 7,533 | 72 |
| 1D = 1 Day; 1M= 1 Month; MTD = Month-To-Date; YTD = Year-To-Date; Chg = Change; Vol = Volume; shr = share; Mkt cap = Market capitalization | ||||||||
Valuation Ratios
| EPS | BPS* | P/E | P/B | P/S | EV/EBITDA | ||
| ttm,mrq | (ttm,KHR) | KHR | (ttm,x) | (mrq,x) | (ttm,x) | (ttm,x) | |
| PPWSA | 1Q25 | 665 | 11,199 | 9.33 | 0.55 | 1.67 | 15.45 |
| GTI | 1Q25 | 55 | 7,057 | 110.05 | 0.86 | 0.74 | 38.45 |
| PPAP | 1Q25 | 2,951 | 22,115 | 4.59 | 0.61 | 1.57 | 3.95 |
| PPSP | 1Q25 | 468 | 3,866 | 4.51 | 0.55 | 1.51 | 4.39 |
| PAS | 1Q25 | 1,212 | 8,224 | 9.89 | 1.46 | 8.68 | 7.61 |
| ABC | 1Q25 | 544 | 13,790 | 12.65 | 0.50 | 4.35 | NA |
| PEPC* | 1Q25 | -88 | -17 | NA | NA | 13.45 | NA |
| MJQE | 4Q24 | 37 | 307 | 53.61 | 6.49 | 3.93 | 11.96 |
| CGSM | 1Q25 | 26 | 606 | 92.74 | 4.02 | 6.92 | 16.66 |
| JSL | 1Q25 | -8 | 685 | NA | 4.07 | 7.50 | 28.66 |
| DBDE | 1Q25 | -12 | 1,840 | NA | 1.10 | 0.40 | 74.32 |
| NOTE: ttm= trailing-twelve months; mrq = most recent quarter; *FY ending in June, **excluding non-voting shares | |||||||
| Corporate Bonds |
Trading Summary
| Bond Symbol | Trading Vol (Units) | Trading Val (KHR'mn) | Latest Yield | Credit Rating | Bond Feature | Coupon Rate (%) | Days to Maturity |
| ABC32A | 0 | 0.0 | - - | khAA | Subordinated Bond | 8.50% | 2,374 |
| ABC32B | 0 | 0.0 | - - | KhAA | Subordinated Bond | 8.50% | 2,416 |
| CGSM33A | 0 | 0.0 | - - | KhAAA | Sustainability Bond | SOFR +3% or 5.5% per annum, whichever is higher | 3,036 |
| CIAF28A | 0 | 0.0 | - - | KhAAA | N/A | 6.30% Annually | 1,240 |
| CIAF30A | 0 | 0.0 | - - | KhAAA | Guaranteed Bond | 5.60% | 1,687 |
| GT27A | 0 | 0.0 | - - | N/A | Plain Bond, Green Bond | 7% per annum | 865 |
| PPSP29A | 0 | 0.0 | - - | KhAAA | Guaranteed Green Bond | Term SOFR + 1.5% | 1,427 |
| RRC32A | 0 | 0.0 | - - | N/A | Plain Bond | 7% Annually | 2,635 |
| RRGO27A | 0 | 0.0 | - - | KhAAA | Guaranteed Bond | SOFR+3,5% or 5% per annum (take which one is higher) | 882 |
| RRGT32B | 0 | 0.0 | - - | KhAAA | Guaranteed Bond | SOFR+3,5% or 5% per annum (take which one is higher) and Year 6 to Year 10: SOFR+3,75% or 5% per annum (take which one is higher) | 2,709 |
| SNTD40A | 0 | 0.0 | - - | N/A | Green Infrastructure Bond | 180-Day SOFR Average + 1.80% | 5,361 |
| SNTD40B | 0 | 0.0 | - - | N/A | Green Infrastructure Bond | 180-Day Average SOFR + 1.60% (4.00% - 6.00%) | 5,361 |
| SNTD40C | 200,000 | 20,000.0 | - - | N/A | Green Infrastructure Bond | 180-Day SOFR Average + 3.00% | 5,361 |
| Government Bonds |
Historical Issuance Summary
| 1 Y | 2 Y | 3 Y | 5 Y | 10 Y | |
| Total issuance ('K units) | 238.1 | 312.0 | 187.3 | 10.0 | 0.0 |
| Outstanding (KHR'bn) | 58.0 | 236.0 | 187.3 | 10.0 | 0.0 |
| Issuance ('K units, Latest) | 34.0 | 0.0 | 12.0 | 0.0 | 0.0 |
| Coupon rate (Latest) | 2.70% | 3.20% | 3.50% | 4.75% | 5.25% |
| Successful yield (Latest) | 3.25% | - | 3.50% | - | - |
| Latest bidding | 23-Apr-25 | 21-May-25 | 25-Jun-25 | 45,581 | 45,525 |
| *Total issuance is the accumulated issuance since September 2022; **Outstanding is aggregate principal value of government that remain outstanding; ***Successful yield: mid yields are shown if multiple price auction method was adopted. | |||||
| Stock Charts |
Main Board
Growth Board