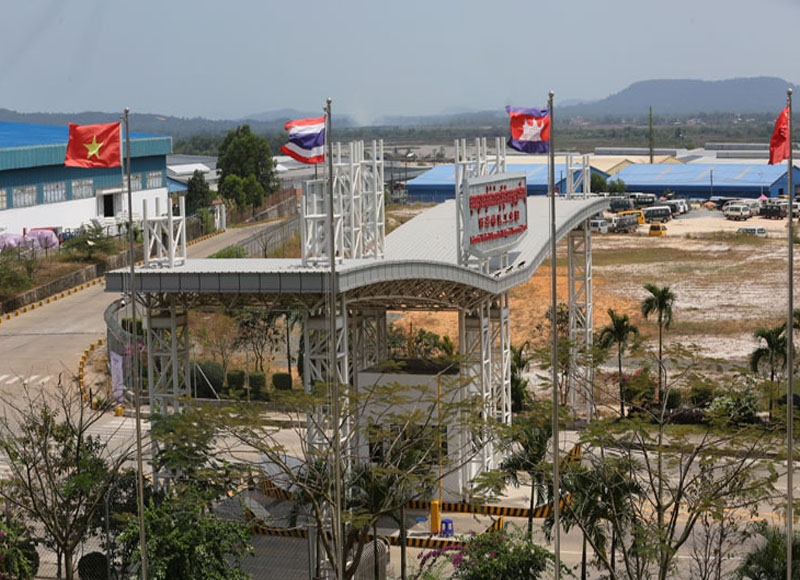
SEZs have driven $26 billion in exports since 2011
| CSX Stocks |
CSX Index
| Value | 1D % Chg | 1D Vol | Mkt Cap (KHR'bn) |
| 460.6 | 0.00 | 52,468 | 12,354 |
Stock Performance
| Stock | Close (KHR) | 1D chg (%) | MTD chg (%) | YTD chg (%) | 1M high (KHR) | 1M low (KHR) | MTD vol (shr) | Mkt cap (KHR'bn) |
| PWSA | 7,420 | -0.27 | -0.27 | -1.85 | 7,480 | 7,300 | 26,473 | 645 |
| GTI | 3,050 | -0.33 | 0.00 | -19.74 | 3,080 | 3,040 | 51,014 | 122 |
| PPAP | 14,080 | -0.28 | -0.28 | 0.57 | 14,180 | 13,960 | 1,620 | 291 |
| PPSP | 2,190 | -0.45 | -0.90 | -8.37 | 2,250 | 2,180 | 14,647 | 157 |
| PAS | 12,200 | 0.00 | -1.61 | -8.41 | 12,640 | 12,200 | 10,338 | 1,046 |
| ABC | 10,020 | 0.00 | 0.00 | -7.39 | 10,040 | 10,000 | 281,882 | 4,340 |
| PEPC | 2,390 | -4.02 | -7.00 | -24.13 | 2,840 | 2,300 | 5,826 | 179 |
| MJQE | 2,140 | 1.42 | -0.93 | NA | 2,200 | 2,100 | 91,545 | 693 |
| CGSM | 2,490 | 0.40 | -5.68 | NA | 2,790 | 2,400 | 301,990 | 4,879 |
| DBDE | 2,160 | -0.46 | -0.46 | -9.62 | 2,210 | 2,150 | 7,144 | 40 |
| JSL | 2,880 | -0.69 | -9.72 | -41.94 | 3,500 | 2,860 | 12,187 | 74 |
| 1D = 1 Day; 1M= 1 Month; MTD = Month-To-Date; YTD = Year-To-Date; Chg = Change; Vol = Volume; shr = share; Mkt cap = Market capitalization | ||||||||
Valuation Ratios
| EPS | BPS* | P/E | P/B | P/S | EV/EBITDA | ||
| ttm,mrq | (ttm,KHR) | KHR | (ttm,x) | (mrq,x) | (ttm,x) | (ttm,x) | |
| PPWSA* | 2Q23 | 1,170 | 15,172 | 6.34 | 0.49 | 1.76 | 8.90 |
| GTI | 2Q23 | 95 | 7,181 | 31.95 | 0.42 | 0.33 | 12.23 |
| PPAP* | 2Q23 | 2,412 | 38,041 | 5.84 | 0.37 | 2.08 | 5.01 |
| PPSP | 2Q23 | 489 | 3,576 | 4.48 | 0.61 | 0.69 | 3.89 |
| PAS* | 2Q23 | 1,191 | 11,029 | 10.24 | 1.11 | 3.15 | 8.04 |
| ABC | 2Q23 | 1,608 | 12,485 | 6.23 | 0.80 | 1.34 | NA |
| PEPC** | 2Q23 | -312 | 1,220 | NA | 1.96 | 2.25 | 31.95 |
| MJQE | 2Q23 | 29 | 289 | 74.28 | 7.39 | 5.65 | 17.76 |
| CGSM | 4Q22 | 85 | 392 | 29.42 | 6.35 | 6.24 | 16.08 |
| JSL | 2Q23 | -239 | 185 | NA | 15.53 | NA | NA |
| DBDE | 2Q23 | 76 | 1,919 | 28.54 | 1.13 | 0.53 | 11.75 |
| NOTE: ttm= trailing-twelve months; mrq = most recent quarter; *Excluding equity of non-common shares for PPWSA, PPAP and PAS; **FY ending in June | |||||||
| Corporate Bonds |
Trading Summary
| Bond Symbol | Trading Vol (Units) | Trading Val (KHR'mn) | Latest Yield | Credit Rating | Bond Feature | Coupon Rate (%) | Days to Maturity |
| GT27A | 0 | 0.0 | - - | N/A | Plain | 7.00% | 1,546 |
| PPCB23B | 0 | 0.0 | - - | N/A | Plain | 6.50% | 10 |
| RMAC25A | 0 | 0.0 | - - | N/A | Plain | 5.50% | 575 |
| RRC32A | 0 | 0.0 | - - | N/A | Plain | 7.00% | 3,316 |
| RRGO27A | 0 | 0.0 | - - | KhAAA | Guaranteed | Floating* | 1,563 |
| RRGT32B | 0 | 0.0 | - - | KhAAA | Guaranteed | Floating** | 3,390 |
| TCT26A | 0 | 0.0 | - - | N/A | Plain | 4.50% | 1,078 |
| *SOFR+3,5% or 5% (take which one is higher); **SOFR+3,5% or 5% (take which one is higher) and Year 6 to Year 10: SOFR+3,75% or 5% (take which one is higher) | |||||||
| Government Bonds |
Historical Issuance Summary
| 1 Y | 2 Y | 3 Y | 10 Y | 15 Y | |
| Total issuance ('K units) | 128.1 | 104.0 | 8.0 | - | - |
| Outstanding (KHR'bn) | 86.3 | 104.0 | 8.0 | - | - |
| Issuance ('K units, Latest) | 28.0 | 28.0 | 4.0 | - | - |
| Coupon rate (Latest) | 3.48% | 4.00% | 4.50% | - | - |
| Successful yield (Latest) | 3.70% | 4.28% | 5.00% | - | - |
| Latest bidding | 45,126 | 45,154 | 45,091 | - | - |
| *Total issuance is the accumulated issuance since September 2022; **Outstanding is aggregate principal value of government that remain outstanding; ***Successful yield: mid yields are shown if multiple price auction method was adopted. | |||||
| News Highlights |
Stock Market
Most CSX stocks fall, but MJQE and CGSM rise On September 12, 2023, the CSX index rose by 0.15% to 460.6 points. PWSA, GTI, PPAP, PPSP, and PEPC all decreased by 0.27%, 0.33%, 0.28%, 0.45%, and 4.02%, respectively. PAS and ABC remained unchanged, while MJQE and CGSM rose by 1.42% and 0.40%, respectively. JSL decreased by 0.69% on the growth board, while DBDE dropped by 0.46%. The trading volume was 52,468 shares, representing KHR 280 million, which was a fall of 50.0% from the previous day's closing volume. (Source: YSC Research)
Economy and Industry
SEZs have driven $26 billion in exports since 2011 Cambodia has 24 special economic zones (SEZs) operating since 2016 with capital investment of $8.1 billion, mainly in sectors like garment, footwear, travel products, auto parts, electronics, car tyre manufacturing, automotive, and bicycle assembly. The Council for the Development of Cambodia (CDC) reports 655 factories and companies employing 174,000 people and a total export value of $25.7 billion between 2011 and June 2023. Garment, footwear, and travel products account for over 90% of investment in SEZs. Exports from SEZs have increased significantly, even during Covid-19. Cambodia's attractiveness is due to political stability, strong economic growth, investment laws, geographical location, young labor, and good infrastructure. Foreign direct investment (FDI) in Cambodia reached $41 billion in 2021, an increase of 11% compared to 2020. (Source: The Phnom Penh Post)
In eight months, 3.4 million travelers pass via international airports Cambodia's international airports in Phnom Penh, Siem Reap, and Sihanoukville welcomed 3.4 million passengers in the eight-month period of 2022, a 180 percent increase from the same period in 2022. The number of flights was 33,146, a 147.6% increase compared to the same period last year. The cargo freight decreased by 10% to 34,881 tons. This growth is attributed to the recovery of air transport in Cambodia after the Covid-19 pandemic, with strict measures on the air transport sector. Reconnecting flights and opening new routes contributed to the growth of air passengers and foreign tourists to Cambodia. In the first seven of 2023, Cambodia recorded 3.03 million international visitors, a 308% increase from the same period last year. (Source: Khmer Times)
The PM will lead a business forum in New York Cambodia and the US Chamber of Commerce will jointly host the Cambodia-US Business Forum in New York next Friday to promote investment and business opportunities in Cambodia. The forum, chaired by Prime Minister Hun Manet, aims to expand relations between the two countries. The CCC delegation plans to hold meetings with leading US companies and Cambodian businessmen and investors in the US to raise awareness about Cambodia's investment opportunities. Cambodia's main export products to the US include apparel, clothing accessories, leather, travel goods, handbags, electrical machinery, and footwear. However, Cambodia's exports to the US declined by 4.8% from $6.24 billion last year. (Source: Khmer Times)
Corporate News
PPAP's eight-month form reveals an increase in transportation Despite a slowdown in the regional and global economy, Phnom Penh Autonomous Port (PPAP) reported a strong business performance in the first eight months of the year. Cargoes and gas-fuel increased by 1% to 2.8 million tonnes in the first eight months, while cargo vessels increased by 19.2% to 3,085 voyages. The number of passengers at the port rose to 12,090 from 435 a year ago. However, containers fell 10% to 269,010 TEUs. CSX market operations department director Kim Sophanita said the slow growth in port operations was short-term and did not negatively affect the port's overall operation. However, PPAP reported a 19% drop in revenue in the first half of the year, with port operation income at $13.6 million, port authority at $2.3 million, and other income at $1.6 million. (Source: The Phnom Penh Post)
| Stock Charts |
Main Board
Growth Board