Cambodia's trade increases by 12.7% YoY in the first half of the year, reaching $26 billion
| News Highlights |
Economy and Industry
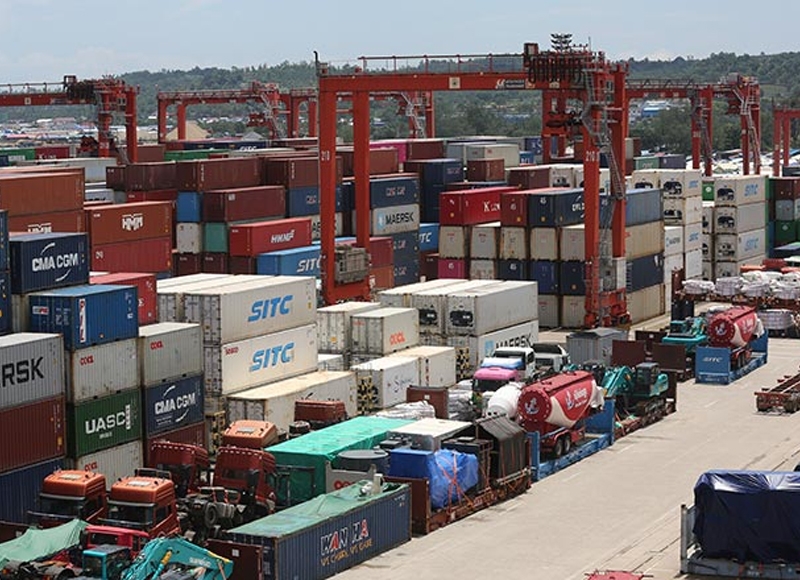
Cambodia's trade increases by 12.7% YoY in the first half of the year, reaching $26 billion Cambodia's international trade reached $26.09 billion in the first half of 2024, marking a 12.7% increase from the same period last year. Exports totaled $12.29 billion, while imports stood at $13.8 billion, resulting in a trade deficit of $1.5 billion by the end of June 2024. China remained Cambodia's largest trading partner, with trade growing 18.8% compared to 2023. The US and Vietnam were also major trading partners, with exports to each country reaching $4.4 billion. Cambodia's trade deficit with China was $5.68 billion, but the country enjoyed a surplus of $4.28 billion with the US. Additionally, Cambodia had a trade deficit of $1.18 billion with Thailand, but a surplus of $307 million with Japan. The recovery of the global economy significantly contributed to Cambodia's trade growth. (Source: Khmer Times)
Government assesses master plan for Sihanoukville The Ministry of Economy and Finance (MEF) and the Inter-Ministerial Coordinating Committee (IMCC) have reviewed the final draft of a master plan to transform Preah Sihanouk province into a Multi-Purpose Special Economic Zone (MP-SEZ). The plan aims to drive economic growth, enhance social communities, and ensure environmental protection. It focuses on three key objectives: establishing the province as a major international gateway, positioning it as a national development hub, and making it one of the largest cities within the ASEAN community. The plan will be executed in two phases, with the first phase running from 2025 to 2028 and the second from 2029 to 2035. The initial phase will concentrate on integrating the province into the local trade system and expanding the logistics and tourism sectors. (Source: Khmer Times)
SaaS and e-commerce startups lead Cambodia's emerging ecosystem Cambodia's startup ecosystem experienced significant growth in 2023, with 129 tech startups out of a total of 177, nearly doubling the number of functional startups from 2022. The startups raised approximately 22.6 billion riels ($5.49 million). Emerging sectors include online media, cleantech, edtech, fintech, the influencer economy, transport and delivery, healthtech, podcasts, online travel, agritech, and blockchain. The ecosystem now features 11 accelerators, six incubation centers, and six hackathons to foster innovation. Despite this progress, the market remains immature, with investors favoring sectors like logistics, fintech, B2B SaaS, web 3.0, edtech, and healthtech. In 2023, the startup scene hosted over 75 programs, 96 events, 65 mentors, and nine stakeholders. Cambodia also boasts five co-working spaces, seven service providers, and 30 corporate partners. The Startup Cambodia initiative, coordinated by the Techo Startup Centre (TSC) and Khmer Enterprise (KE), aims to create a dynamic startup ecosystem that supports the revival and promotion of Cambodia's economy and society. (Source: Khmer Times)
Corporate News
BYD leads the way in Cambodia's electric vehicle market China's BYD has taken an early lead in Cambodia's electric vehicle (EV) market, selling 658 cars in the first six months of 2024, accounting for over 40% of the 1,614 EVs sold in the country. In total, 2,968 electric vehicles were officially registered during this period, including 914 motorcycles, 440 tricycles, and 1,614 cars. Demand for EVs is steadily increasing in Cambodia, with a growing public interest in electric vehicles. The Royal Government of Cambodia is working to expand the number of charging stations across the country. The Electric Vehicle (EV) Roadmap for Charging Stations anticipates over a million EVs in Cambodia between 2030 and 2040, and around 100,000 electric cars between 2035 and 2042. To support this growth, the country will need significant charging infrastructure, requiring investments between $168 million and $576 million. (Source: Khmer Times)
Stock Market
CSX index declines 0.51% on July 11, 2024 On July 11, 2024, the CSX index closed at 413.4 points, reflecting a decrease of 0.51% from the previous day. On the main board, GTI (+1.85%) and MJQE (+0.49%) saw gains. Conversely, CGSM (-1.24%), PPAP (-0.48%), and PAS (-0.17%) declined, while PWSA, PPSP, ABC, and PEPC held steady at their opening prices. On the growth board, DBDE dropped by 0.48% and JSL maintained its opening price. The total trading volume for the day amounted to 84,211 shares, with a cumulative trading value of KHR 333 million. (Source: YSC Research)
| CSX Stocks |
CSX Index
| Value | 1D % Chg | 1D Vol | Mkt Cap (KHR'bn) |
| 413.44 | -0.51 | 84,211 | 11,089 |
Stock Performance
| Stock | Close (KHR) | 1D chg (%) | MTD chg (%) | YTD chg (%) | 1M high (KHR) | 1M low (KHR) | MTD vol (shr) | Mkt cap (KHR'bn) |
| PWSA | 7,040 | 0.00 | 0.86 | -3.30 | 7,080 | 6,940 | 120,072 | 612 |
| GTI | 3,310 | 1.85 | 15.33 | 16.55 | 3,310 | 2,270 | 491,600 | 132 |
| PPAP | 16,720 | -0.48 | 30.83 | 19.43 | 17,240 | 12,700 | 112,547 | 346 |
| PPSP | 2,280 | 0.00 | 3.17 | 4.59 | 2,300 | 2,140 | 273,855 | 164 |
| PAS | 12,100 | -0.17 | -0.49 | -3.82 | 12,320 | 11,880 | 74,784 | 1,038 |
| ABC | 7,540 | 0.00 | -0.79 | -25.05 | 7,600 | 7,380 | 217,362 | 3,266 |
| PEPC | 2,450 | 0.00 | 10.36 | -10.58 | 2,450 | 2,120 | 10,769 | 184 |
| MJQE | 2,050 | 0.49 | 0.49 | -3.76 | 2,050 | 2,030 | 90,527 | 664 |
| CGSM | 2,390 | -1.24 | -2.45 | -9.13 | 2,460 | 2,390 | 152,269 | 4,683 |
| DBDE | 2,080 | -0.48 | 0.00 | -2.80 | 2,290 | 2,060 | 48,693 | 38 |
| JSL | 3,640 | 0.00 | -0.27 | -17.27 | 3,790 | 3,360 | 4,540 | 94 |
| 1D = 1 Day; 1M= 1 Month; MTD = Month-To-Date; YTD = Year-To-Date; Chg = Change; Vol = Volume; shr = share; Mkt cap = Market capitalization | ||||||||
Valuation Ratios
| EPS | BPS* | P/E | P/B | P/S | EV/EBITDA | ||
| ttm,mrq | (ttm,KHR) | KHR | (ttm,x) | (mrq,x) | (ttm,x) | (ttm,x) | |
| PPWSA | 1Q24 | 1,298 | 16,580 | 5.42 | 0.42 | 1.60 | 9.97 |
| GTI | 1Q24 | 106 | 7,068 | 31.12 | 0.47 | 0.40 | 12.69 |
| PPAP | 1Q24 | 1,952 | 38,178 | 8.57 | 0.44 | 2.47 | 5.83 |
| PPSP | 1Q24 | 445 | 3,501 | 5.12 | 0.65 | 1.19 | 5.58 |
| PAS | 1Q24 | 1,803 | 11,721 | 6.71 | 1.03 | 3.01 | 5.71 |
| ABC | 1Q24 | 1,518 | 13,222 | 4.97 | 0.57 | 0.97 | NA |
| PEPC* | 4Q23 | -477 | 842 | NA | 2.91 | 4.30 | 65.63 |
| MJQE | 4Q23 | 59 | 297 | 34.82 | 6.91 | 4.44 | 13.75 |
| CGSM | 4Q23 | 166 | 563 | 14.38 | 4.24 | 6.27 | 15.13 |
| JSL | 4Q23 | 274 | 593 | 13.27 | 6.14 | 1.36 | NA |
| DBDE | 1Q24 | 250 | 1,930 | 8.33 | 1.08 | 0.49 | 5.62 |
| NOTE: ttm= trailing-twelve months; mrq = most recent quarter; *FY ending in June | |||||||
| Corporate Bonds |
Trading Summary
| Bond Symbol | Trading Vol (Units) | Trading Val (KHR'mn) | Latest Yield | Credit Rating | Bond Feature | Coupon Rate (%) | Days to Maturity |
| CGSM33A | 0 | 0.0 | - - | KhAAA | Sustainability | Floating* | 3,414 |
| CIAF28A | 0 | 0.0 | - - | KhAAA | N/A | 6.30% | 1,618 |
| GT27A | 0 | 0.0 | - - | N/A | Plain , Green | 7.00% | 1,243 |
| PPSP29A | 0 | 0.0 | - - | KhAAA | Guaranteed Green | Term SOFR + 1.5% | 1,805 |
| RMAC25A | 0 | 0.0 | - - | N/A | Guaranteed | 5.50% | 272 |
| RRC32A | 0 | 0.0 | - - | N/A | Plain | 7.00% | 3,013 |
| RRGO27A | 0 | 0.0 | - - | KhAAA | Guaranteed | Floating** | 1,260 |
| RRGT32B | 0 | 0.0 | - - | KhAAA | Guaranteed | Floating*** | 3,087 |
| TCT26A | 0 | 0.0 | - - | N/A | Plain | 4.50% | 775 |
| TCT28A | 0 | 0.0 | - - | KhAAA | FX-Linked | Floating**** | 1,632 |
| *SOFR +3% or 5.5% , whichever is higher; **SOFR+3,5% or 5% (take which one is higher);***SOFR+3,5% or 5% (take which one is higher) and Year 6 to Year 10: SOFR+3,75% or 5% (take which one is higher);****Term SOFR + 2.5% | |||||||
| Government Bonds |
Historical Issuance Summary
| 1 Y | 2 Y | 3 Y | 10 Y | 15 Y | |
| Total issuance ('K units) | 180.1 | 312.0 | 65.3 | - | - |
| Outstanding (KHR'bn) | 80.0 | 312.0 | 65.3 | - | - |
| Issuance ('K units, Latest) | 10.0 | 20.0 | 43.3 | - | - |
| Coupon rate (Latest) | 3.50% | 4.00% | 4.50% | - | - |
| Successful yield (Latest) | 3.85% | 4.00% | 4.63% | - | - |
| Latest bidding | 24-Apr-24 | 29-May-24 | 26-Jun-24 | - | - |
| *Total issuance is the accumulated issuance since September 2022; **Outstanding is aggregate principal value of government that remain outstanding; ***Successful yield: mid yields are shown if multiple price auction method was adopted. | |||||
| Stock Charts |
Main Board
Growth Board