Cambodia sees strong growth in garment and footwear exports, reaching $15.5B in 2025
| News Highlights |
Economy and Industry
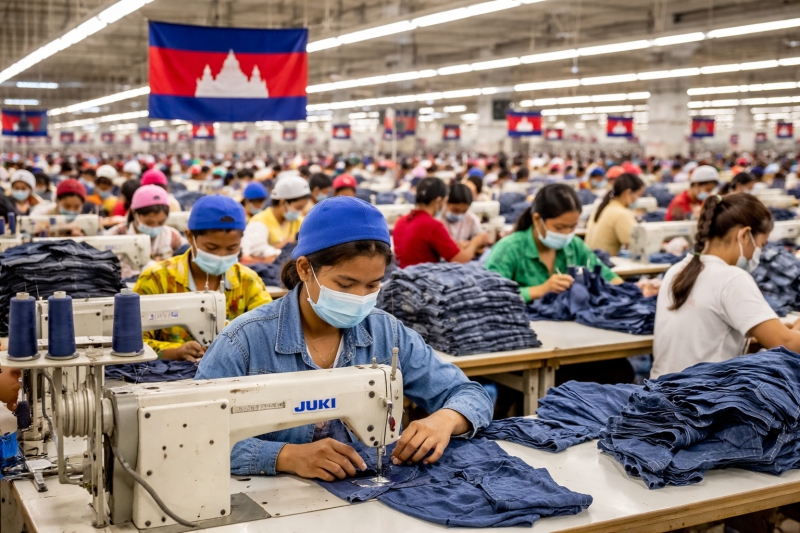
Cambodia sees strong growth in garment and footwear exports, reaching $15.5B in 2025 Cambodia's garment, footwear, and travel goods exports reached $15.5 billion in 2025, marking a 15.7% increase from the previous year, according to the Ministry of Commerce. Garments accounted for $11.4 billion (up 16.5%), footwear at $2.09 billion (up 24.5%), and travel goods at $2.02 billion (up 3.8%). The sector, employing over 900,000 people, primarily women, remains key to foreign currency earnings, accounting for about 50% of total exports. Thong Mengdavid from the Cambodia University of Technology and Science noted that diversification of markets and the Regional Comprehensive Economic Partnership (RCEP) significantly contributed to this growth, which is expected to continue due to external demand and investments from China, South Korea, and Japan. (Source: Khmer Times)
World Bank forecasts temporary slowdown for Cambodia, with growth picking up in 2027 Cambodia's economy is projected to slow to 4.3% growth in 2026, after a 4.8% increase in 2025, before rebounding to 5.1% in 2027, according to the World Bank. This moderation is attributed to a softer global economy, trade growth slowdown, and lingering uncertainties impacting exports and investment. Despite these challenges, a medium-term recovery is expected, supported by easing inflation, a gradual tourism recovery, and ongoing infrastructure investments. The Ministry of Economy and Finance forecasts a 5% growth in 2026, estimating the GDP at approximately $53.79 billion, though potential challenges lie ahead with Cambodia's impending graduation from least developed country status in 2029, which may impact access to developmental aid. Structural reforms focusing on economic diversification and responding to external pressures are vital for sustaining growth and developing resilience against global economic shocks. (Source: Khmer Times)
Gold, Silver surge to records as stock markets slip on trade concerns Gold and silver prices reached record highs as equity markets dipped, following President Trump's threats to impose tariffs on eight European nations over their resistance to the U.S. claim on Greenland. He announced a 10% tariff from February 1, increasing to 25% by June 1, prompting a joint statement from the affected countries denouncing the tariff threats. This situation jeopardizes a prior trade agreement between the U.S. and the EU, with France considering activating an "anti-coercion instrument" to retaliate. Market reactions included gains in safe-haven assets, while major equity markets in Asia retreated. Analysts indicate the potential for increased trade tensions and caution against politicized trade environments, alongside muted reactions to China's economic growth data. (Source: Khmer Times)
Corporate News
Japan targets long-term growth in Cambodia's water supply sector Water supply business operations are crucial for public health and economic development, highlighted by a meeting between Kitakyushu's delegation and Cambodia's MISTI minister, Hem Vanndy. Kitakyushu aims to expand its water supply operations in Cambodia, reflecting strengthened bilateral relations and private sector engagement in the water and sanitation sector. The collaboration dates back to 1996 and was reaffirmed through a Memorandum of Understanding, emphasizing long-term partnerships focusing on sustainable development. The delegation, including 15 private companies, plans to showcase technologies at an upcoming Cambodia-Japan workshop, while efforts continue to address access challenges in rural areas. MISTI is strengthening regulations to enhance service quality and attract international partners for universal clean water access. (Source: Khmer Times)
Stock Market
CSX rises to 423.9 as ABC drives volume The CSX Index closed higher at 423.9 (+0.47%) with a trading volume of 158,299 shares. On the Main Board, price movements were mixed as ABC and GTI posted modest gains, PEPC edged lower, while several stocks including PWSA, PPAP, PPSP, PAS, MJQE, and CGSM ended unchanged; trading activity was concentrated in ABC. On the Growth Board, sentiment was negative, led by a decline in DBDE, while JSL closed flat. (Source: YSC Research)
| CSX Stocks |
CSX Index
| Value | 1D % Chg | 1D Vol | Mkt Cap (KHR'bn) |
| 423.87 | 0.47 | 158,299 | 11,712 |
Stock Performance
| Stock | Close (KHR) | 1D chg (%) | MTD chg (%) | YTD chg (%) | 1M high (KHR) | 1M low (KHR) | MTD vol (shr) | Mkt cap (KHR'bn) |
| PWSA | 6,340 | 0.00 | 0.00 | 0.00 | 6,380 | 6,300 | 70,126 | 551 |
| GTI | 8,160 | 0.49 | 1.75 | 1.75 | 8,200 | 7,060 | 42,795 | 326 |
| PPAP | 14,140 | 0.00 | -1.12 | -1.12 | 14,400 | 14,140 | 17,815 | 292 |
| PPSP | 2,100 | 0.00 | 1.45 | 1.45 | 2,120 | 2,030 | 195,991 | 151 |
| PAS | 13,060 | 0.00 | 0.77 | 0.77 | 13,080 | 12,760 | 10,468 | 1,120 |
| ABC | 7,240 | 1.69 | -1.09 | -1.09 | 7,460 | 7,120 | 867,032 | 3,136 |
| PEPC | 2,790 | -0.36 | -1.06 | -1.06 | 2,890 | 2,780 | 6,517 | 209 |
| MJQE | 2,050 | 0.00 | 0.99 | 0.99 | 2,070 | 2,000 | 119,488 | 664 |
| CGSM | 2,510 | 0.00 | 0.80 | 0.80 | 2,510 | 2,470 | 78,847 | 4,918 |
| DBDE | 2,190 | -0.45 | 0.92 | 0.92 | 2,220 | 2,150 | 16,921 | 40 |
| JSL | 2,490 | 0.00 | 1.22 | 1.22 | 2,520 | 2,420 | 97,544 | 64 |
| 1D = 1 Day; 1M= 1 Month; MTD = Month-To-Date; YTD = Year-To-Date; Chg = Change; Vol = Volume; shr = share; Mkt cap = Market capitalization | ||||||||
Valuation Ratios
| EPS | BPS* | P/E | P/B | P/S | EV/EBITDA | ||
| ttm,mrq | (ttm,KHR) | KHR | (ttm,x) | (mrq,x) | (ttm,x) | (ttm,x) | |
| PPWSA | 2Q25 | 827 | 11,622 | 7.66 | 0.55 | 1.73 | 14.97 |
| GTI | 2Q25 | 29 | 7,023 | 280.03 | 1.16 | 0.99 | 44.18 |
| PPAP | 1Q25 | 2,951 | 22,115 | 4.79 | 0.64 | 1.64 | 4.11 |
| PPSP | 2Q25 | 735 | 4,376 | 2.86 | 0.48 | 0.96 | 2.13 |
| PAS | 1Q25 | 1,212 | 8,224 | 10.78 | 1.59 | 2.35 | 8.09 |
| ABC | 2Q25 | 1,460 | 14,410 | 4.96 | 0.50 | 0.87 | NA |
| PEPC* | 3Q25 | -1,445 | -1,303 | NA | NA | 3.34 | NA |
| MJQE | 2Q25 | 45 | 340 | 45.38 | 6.03 | 4.01 | 13.10 |
| CGSM | 2Q25 | 25 | 618 | 102.17 | 4.06 | 7.17 | 19.84 |
| JSL | 2Q25 | -82 | 492 | NA | 5.06 | 18.43 | 32.25 |
| DBDE | 2Q25 | 147 | 1,933 | 14.94 | 1.13 | 0.33 | 7.58 |
| NOTE: ttm= trailing-twelve months; mrq = most recent quarter; *FY ending in June, **excluding non-voting shares | |||||||
| Corporate Bonds |
Trading Summary
| Bond Symbol | Trading Vol (Units) | Trading Val (KHR'mn) | Latest Yield | Credit Rating | Bond Feature | Coupon Rate (%) | Days to Maturity |
| ABC32A | 0 | 0.0 | - - | khAA | Subordinated Bond | 8.50% | 2,194 |
| ABC32B | 0 | 0.0 | - - | KhAA | Subordinated Bond | 8.50% | 2,236 |
| ABC32C | 0 | 0.0 | - - | khAA | Subordinated Bond | 7.50% p.a. | 2,427 |
| CGSM33A | 0 | 0.0 | - - | KhAAA | Sustainability Bond | SOFR +3% or 5.5% per annum, whichever is higher | 2,856 |
| CIAF28A | 0 | 0.0 | - - | KhAAA | N/A | 6.30% Annually | 1,060 |
| CIAF30A | 0 | 0.0 | - - | KhAAA | Guaranteed Bond | 5.60% | 1,507 |
| GT27A | 0 | 0.0 | - - | N/A | Plain Bond, Green Bond | 7% per annum | 685 |
| PPSP29A | 0 | 0.0 | - - | KhAAA | Guaranteed Green Bond | Term SOFR + 1.5% | 1,247 |
| RRC32A | 0 | 0.0 | - - | N/A | Plain Bond | 7% Annually | 2,455 |
| RRGO27A | 0 | 0.0 | - - | KhAAA | Guaranteed Bond | SOFR+3,5% or 5% per annum (take which one is higher) | 702 |
| RRGT32B | 0 | 0.0 | - - | KhAAA | Guaranteed Bond | SOFR+3,5% or 5% per annum (take which one is higher) and Year 6 to Year 10: SOFR+3,75% or 5% per annum (take which one is higher) | 2,529 |
| SNTD40A | 0 | 0.0 | - - | N/A | Green Infrastructure Bond | 180-Day SOFR Average + 1.80% | 5,181 |
| SNTD40B | 0 | 0.0 | - - | N/A | Green Infrastructure Bond | 180-Day Average SOFR + 1.60% (4.00% - 6.00%) | 5,181 |
| Government Bonds |
Historical Issuance Summary
| 1 Y | 2 Y | 3 Y | 5 Y | 10 Y | |
| 15 Y | |||||
| Total issuance ('K units) | 238.1 | 312.0 | 406.8 | 38.0 | 6.0 |
| 64.0 | |||||
| Outstanding (KHR'bn) | 58.0 | 180.0 | 406.8 | 38.0 | 0.0 |
| 0.0 | |||||
| Issuance ('K units, Latest) | 34.0 | 0.0 | 22.0 | 20.0 | 6.0 |
| 64.0 | |||||
| Coupon rate (Latest) | 2.70% | 3.20% | 3.50% | 4.30% | 4.30% |
| 4.60% | |||||
| Successful yield (Latest) | 3.25% | 3.90% | 4.50% | 4.75% | |
| 5.35% | |||||
| Latest bidding | 23-Apr-25 | 21-May-25 | 10-Dec-25 | 46,001 | 46,001 |
| 46,001 | |||||
| *Total issuance is the accumulated issuance since September 2022; **Outstanding is aggregate principal value of government that remain outstanding; ***Successful yield: mid yields are shown if multiple price auction method was adopted. | |||||
| Stock Charts |
Main Board
Growth Board