Cambodia's exports to the EU and ASEAN record double-digit growth in the first 10 months of 2025
| News Highlights |
Economy and Industry
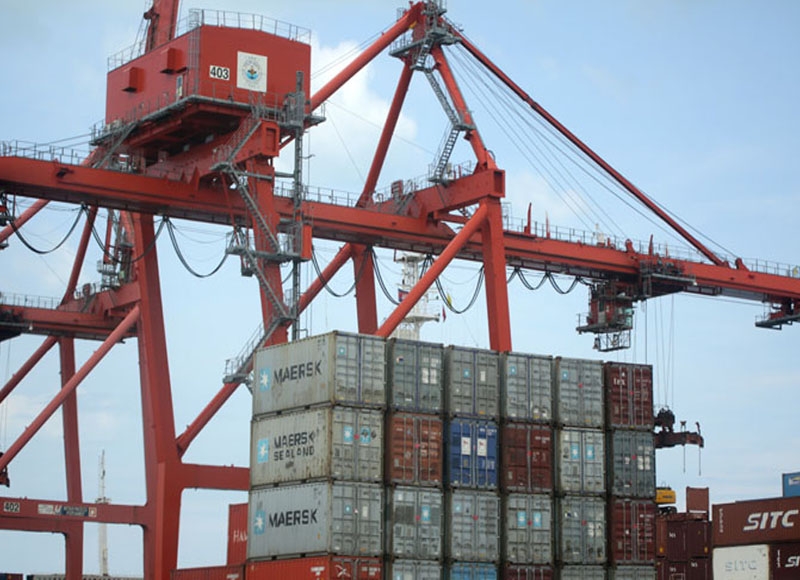
Cambodia's exports to the EU and ASEAN record double-digit growth in the first 10 months of 2025 Cambodia experienced significant growth in exports during the first 10 months of 2025, particularly to the European Union (EU) and the Association of Southeast Asian Nations (ASEAN), as detailed in a Ministry of Commerce report. Exports to the EU reached $4.21 billion, reflecting a 17.3% increase from the previous year. Concurrently, exports to ASEAN countries totaled $4.8 billion, marking a 16% rise. The EU and ASEAN markets comprised 16.2% and 18.5% of Cambodia's total export volume of $25.9 billion, respectively. The primary goods exported to the EU included apparel, textiles, shoes, travel goods, bicycles, car tyres, electronics, and agricultural products such as milled rice and cashew nuts. Similarly, exports to ASEAN largely consisted of garments, footwear, travel items, electronics, and agricultural commodities. (Source: Khmer Times)
Cambodia records 5.66 million foreign air passengers in Jan-Oct 2025 Cambodia has reported 5.66 million international air passengers from January to October 2025, marking a 14% increase year-on-year, according to an official report from the State Secretariat of Civil Aviation (SSCA). During this period, 34 international and domestic airlines operated a total of 52,954 flights to the country's three international airports, reflecting a 12% rise compared to the previous year. Additionally, air cargo volume increased by 14%, totaling 74,912 tonnes. The three international airports currently in operation - Techo International Airport, Siem Reap Angkor International Airport, and Sihanouk International Airport - accommodate an average of 1,320 flights weekly, as noted by SSCA's Secretary of State and Spokesperson Sinn Chanserey Vutha. (Source: Khmer Times)
ADB updates charter to support a 50% boost in lending The Asian Development Bank (ADB) has ratified a significant amendment to its founding charter, enabling a 50% increase in annual lending to over $36 billion. This decision allows ADB to better support developing member countries in addressing critical development priorities without imposing additional burdens on shareholders. ADB President Masato Kanda emphasized that this historic change, the first since 1966, will facilitate efforts to reduce poverty, enhance educational opportunities, and strengthen vulnerable communities. The Capital Utilization Plan aims to grow ADB's financing commitments from $24 billion in 2024 to over $36 billion by 2034, with a goal to quadruple private sector financing to $13 billion annually by 2030. (Source: Khmer Times)
Corporate News
ABA Bank awarded "Financial Innovation of the Year" for its digital banking leadership ABA Bank has been awarded the Financial Innovation of the Year - Financial Services at the Asian Innovation Excellence Awards 2025 for its leadership in digital banking. The ceremony, held on November 5 in Singapore, highlighted the success of ABA Mobile, the Bank's digital banking application, which has empowered Cambodians to manage their finances over the past decade. Key innovations include FacePass Secure, a facial recognition feature for transaction security, and Navi, an AI-powered virtual banking assistant. Additionally, the app introduces personal finance management tools to help users track spending and budget effectively, demonstrating the Bank's commitment to innovative financial solutions. (Source: Cambodia Investment Review)
Stock Market
CSX gains 0.26% as PAS leads main board On 19 November 2025, the CSX Index rose 0.26% to close at 413.2 points. On the Main Board, PAS (+0.82%), CGSM (+0.40%), and PWSA (+0.32%) recorded gains, while PPAP (-0.29%) posted a loss. GTI, PPSP, ABC, PEPC, and MJQE remained unchanged. On the Growth Board, DBDE increased 2.35%, while JSL decreased 0.37%. Total trading volume reached 44,809 shares, with a turnover of KHR 171 million. (Source: YSC Research)
| CSX Stocks |
CSX Index
| Value | 1D % Chg | 1D Vol | Mkt Cap (KHR'bn) |
| 413.19 | 0.26 | 44,809 | 11,082 |
Stock Performance
| Stock | Close (KHR) | 1D chg (%) | MTD chg (%) | YTD chg (%) | 1M high (KHR) | 1M low (KHR) | MTD vol (shr) | Mkt cap (KHR'bn) |
| PWSA | 6,220 | 0.32 | 0.97 | -2.20 | 6,220 | 6,140 | 36,628 | 541 |
| GTI | 7,040 | 0.00 | -0.28 | 38.58 | 7,100 | 6,980 | 40,297 | 282 |
| PPAP | 13,760 | -0.29 | 1.78 | -0.58 | 13,800 | 6,220 | 6,892 | 285 |
| PPSP | 2,060 | 0.00 | 0.49 | -5.07 | 2,070 | 2,030 | 209,823 | 148 |
| PAS | 12,360 | 0.82 | 1.81 | 6.92 | 12,360 | 12,100 | 4,406 | 1,060 |
| ABC | 7,000 | 0.00 | 3.55 | -7.16 | 7,180 | 6,740 | 500,734 | 3,032 |
| PEPC | 2,600 | 0.00 | 3.59 | 7.44 | 2,650 | 2,500 | 1,735 | 195 |
| MJQE | 1,980 | 0.00 | 0.00 | -4.81 | 1,980 | 1,960 | 95,248 | 642 |
| CGSM | 2,500 | 0.40 | 1.63 | 2.88 | 6,220 | 2,430 | 41,334 | 4,898 |
| DBDE | 2,180 | 2.35 | 7.92 | 5.83 | 2,180 | 2,000 | 18,233 | 40 |
| JSL | 2,690 | -0.37 | -3.58 | -21.35 | 2,840 | 2,670 | 5,898 | 69 |
| 1D = 1 Day; 1M= 1 Month; MTD = Month-To-Date; YTD = Year-To-Date; Chg = Change; Vol = Volume; shr = share; Mkt cap = Market capitalization | ||||||||
Valuation Ratios
| EPS | BPS* | P/E | P/B | P/S | EV/EBITDA | ||
| ttm,mrq | (ttm,KHR) | KHR | (ttm,x) | (mrq,x) | (ttm,x) | (ttm,x) | |
| PPWSA | 2Q25 | 827 | 11,622 | 7.52 | 0.54 | 1.70 | 14.89 |
| GTI | 2Q25 | 29 | 7,023 | 241.59 | 1.00 | 0.86 | 39.69 |
| PPAP | 1Q25 | 2,951 | 22,115 | 4.66 | 0.62 | 1.60 | 4.01 |
| PPSP | 2Q25 | 735 | 4,376 | 2.80 | 0.47 | 0.94 | 2.08 |
| PAS | 1Q25 | 1,212 | 8,224 | 10.20 | 1.50 | 2.22 | 7.78 |
| ABC | 2Q25 | 1,460 | 14,410 | 4.79 | 0.49 | 0.84 | NA |
| PEPC* | 3Q25 | -1,445 | -1,303 | NA | NA | 3.11 | NA |
| MJQE | 2Q25 | 45 | 340 | 43.83 | 5.82 | 3.87 | 12.70 |
| CGSM | 2Q25 | 25 | 618 | 101.76 | 4.04 | 7.14 | 19.77 |
| JSL | 2Q25 | -82 | 492 | NA | 5.46 | 19.91 | 33.71 |
| DBDE | 2Q25 | 147 | 1,933 | 14.87 | 1.13 | 0.33 | 7.56 |
| NOTE: ttm= trailing-twelve months; mrq = most recent quarter; *FY ending in June, **excluding non-voting shares | |||||||
| Corporate Bonds |
Trading Summary
| Bond Symbol | Trading Vol (Units) | Trading Val (KHR'mn) | Latest Yield | Credit Rating | Bond Feature | Coupon Rate (%) | Days to Maturity |
| ABC32A | 0 | 0.0 | - - | khAA | Subordinated Bond | 8.50% | 2,256 |
| ABC32B | 0 | 0.0 | - - | KhAA | Subordinated Bond | 8.50% | 2,298 |
| ABC32C | 0 | 0.0 | - - | khAA | Subordinated Bond | 7.50% p.a. | 2,489 |
| CGSM33A | 0 | 0.0 | - - | KhAAA | Sustainability Bond | SOFR +3% or 5.5% per annum, whichever is higher | 2,918 |
| CIAF28A | 0 | 0.0 | - - | KhAAA | N/A | 6.30% Annually | 1,122 |
| CIAF30A | 0 | 0.0 | - - | KhAAA | Guaranteed Bond | 5.60% | 1,569 |
| GT27A | 0 | 0.0 | - - | N/A | Plain Bond, Green Bond | 7% per annum | 747 |
| PPSP29A | 0 | 0.0 | - - | KhAAA | Guaranteed Green Bond | Term SOFR + 1.5% | 1,309 |
| RRC32A | 0 | 0.0 | - - | N/A | Plain Bond | 7% Annually | 2,517 |
| RRGO27A | 0 | 0.0 | - - | KhAAA | Guaranteed Bond | SOFR+3,5% or 5% per annum (take which one is higher) | 764 |
| RRGT32B | 0 | 0.0 | - - | KhAAA | Guaranteed Bond | SOFR+3,5% or 5% per annum (take which one is higher) and Year 6 to Year 10: SOFR+3,75% or 5% per annum (take which one is higher) | 2,591 |
| SNTD40A | 0 | 0.0 | - - | N/A | Green Infrastructure Bond | 180-Day SOFR Average + 1.80% | 5,243 |
| SNTD40B | 0 | 0.0 | - - | N/A | Green Infrastructure Bond | 180-Day Average SOFR + 1.60% (4.00% - 6.00%) | 5,243 |
| Government Bonds |
Historical Issuance Summary
| 1 Y | 2 Y | 3 Y | 5 Y | 10 Y | |
| Total issuance ('K units) | 238.1 | 312.0 | 384.8 | 18.0 | 0.0 |
| Outstanding (KHR'bn) | 58.0 | 208.0 | 384.8 | 18.0 | 0.0 |
| Issuance ('K units, Latest) | 34.0 | 0.0 | 157.5 | 8.0 | 0.0 |
| Coupon rate (Latest) | 2.70% | 3.20% | 3.40% | 4.34% | 4.60% |
| Successful yield (Latest) | 3.25% | - | 3.90% | 5.00% | - |
| Latest bidding | 23-Apr-25 | 21-May-25 | 22-Oct-25 | 45,861 | 45,889 |
| *Total issuance is the accumulated issuance since September 2022; **Outstanding is aggregate principal value of government that remain outstanding; ***Successful yield: mid yields are shown if multiple price auction method was adopted. | |||||
| Stock Charts |
Main Board
Growth Board