Cambodia's export momentum continues amid increasing tariffs
| News Highlights |
Economy and Industry
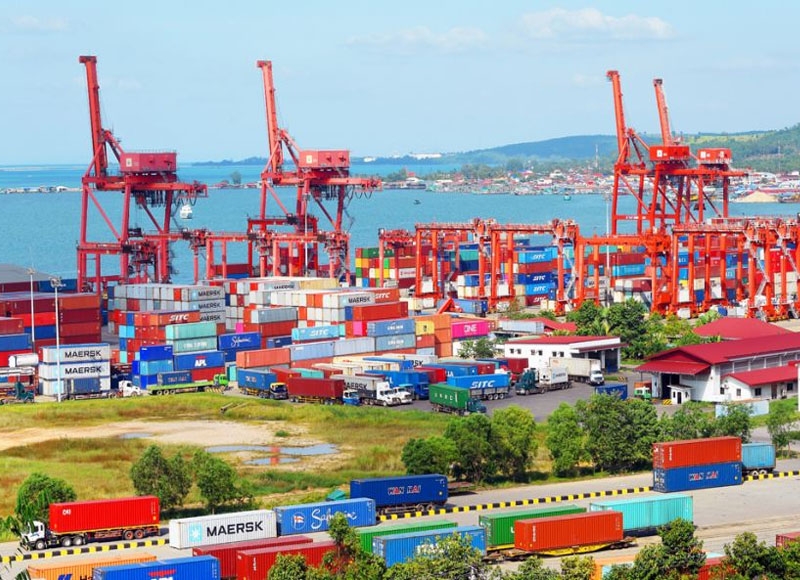
Cambodia's export momentum continues amid increasing tariffs Business leaders noted that Cambodia's sustained export growth, which increased by nearly 13% in the first nine months of the year to around $22 billion, illustrates the nation's economic diversification and enhanced competitiveness. The USA remains the largest market for Cambodian products, followed by Vietnam, China, and Japan. This growth persists despite new trade policies and tariff hikes in key markets, especially affecting garments, footwear, and agricultural products. Government officials, including Penn Sovicheat from the Ministry of Commerce, attribute this success to effective strategies for navigating global trade challenges and working closely with industries to improve efficiency. Key drivers for this growth include trade preferences from Free Trade Agreements (FTA) and Regional Comprehensive Economic Partnership (RCEP), increasing Foreign Direct Investment (FDI), and a significant rise in manufacturing and infrastructure investment, totaling $7.8 billion across 546 projects approved in the first nine months of the year. This trend demonstrates strong potential for long-term economic stability, even as imports also rose by 16.6 percent, reaching approximately $24.61 billion. (Source: Khmer Times)
Cambodia experiences 6.6% drop in waterway exports to Thailand in September Following the closure of land crossings, Cambodia's agricultural exports to Thailand via waterways decreased to 1,728 tonnes, worth $5.8 million between June 24 and September 30, 2025, with September exports falling 6.6% from August. In total, Cambodia exported 11.1 million tonnes of agricultural goods to 88 countries from January to September 2025, marking a 30.4% increase compared to the prior year, majorly comprising rice and other non-rice crops. Despite some drops in specific products like fresh cassava and mangoes due to processing changes, dried cassava exports surged 57.6% and processed cassava expanded 83.5%. Meanwhile, Thailand's overall border trade experienced a significant drop of 23.6% in August, particularly with Cambodia, where trade fell nearly entirely. Both countries acknowledged the interconnectedness of their trading activities despite import restrictions. (Source: Kiripost)
AMRO Report 2025: Cambodia's expanding digital banking boosts financial resilience Cambodia's digital banking ecosystem is rapidly expanding, strengthening financial resilience in ASEAN, according to AMRO's ASEAN+3 Financial Stability Report 2025. Led by the NBC's Bakong payment system, digitalization has improved access to formal finance and boosted e-wallet and mobile payment adoption. While enhancing inclusion, it also brings risks like cybersecurity threats, requiring stronger regulatory oversight. Despite exposure to external shocks, Cambodia's financial sector remains solid, with well-capitalized banks and manageable debt. AMRO recommends cautious regulation and deeper regional cooperation to sustain digital innovation benefits. (Source: Cambodia Investment Review)
Corporate News
ACLEDA Bank receives Gold Certification for excellence in client protection ACLEDA Bank has achieved the Gold Level Certification for Client Protection from MFR Global Rating Agency, affirming its dedication to ethical banking practices. This certification indicates that ACLEDA Bank fully adheres to the Universal Standards for Social Performance Management, which include principles such as Appropriate Product Design and Delivery, Prevention of Over-Indebtedness, Transparency, Responsible Pricing, Fair Treatment of Clients, Privacy of Client Data, Complaint Resolution Mechanisms, and Strong Governance and HR Practices. Moreover, ACLEDA Bank meets internationally recognized security standards, including PCI-DSS, ISO/IEC 27001:2022, and ISO/IEC 27701:2019, thereby ensuring high levels of data security and privacy protection for its clients. This milestone underscores ACLEDA Bank's commitment to promoting trust, transparency, and client welfare through responsible financial services. (Source: Cambodia Investment Review)
Stock Market
CSX index dips 0.43% amid mixed main board performance On 13 October 2025, the CSX Index fell 0.43% to close at 403.8 points. On the Main Board, GTI (+0.85%) and PAS (+0.50%) posted gains, while ABC (-1.74%), PWSA (-0.32%), and PPAP (-0.15%) recorded losses. PPSP, PEPC, MJQE, and CGSM remained unchanged. On the Growth Board, DBDE remained unchanged, whereas JSL rose 0.73%. Total trading volume reached 74,368 shares, with a turnover of KHR 340 million. (Source: YSC Research)
| CSX Stocks |
CSX Index
| Value | 1D % Chg | 1D Vol | Mkt Cap (KHR'bn) |
| 403.81 | -0.43 | 74,368 | 10,831 |
Stock Performance
| Stock | Close (KHR) | 1D chg (%) | MTD chg (%) | YTD chg (%) | 1M high (KHR) | 1M low (KHR) | MTD vol (shr) | Mkt cap (KHR'bn) |
| PWSA | 6,160 | -0.32 | 0.00 | -3.14 | 6,220 | 6,140 | 30,152 | 536 |
| GTI | 7,140 | 0.85 | 0.56 | 40.55 | 7,140 | 6,900 | 10,757 | 286 |
| PPAP | 13,500 | -0.15 | -0.59 | -2.46 | 13,600 | 13,500 | 2,854 | 279 |
| PPSP | 2,050 | 0.00 | -0.49 | -5.53 | 2,070 | 2,050 | 67,201 | 147 |
| PAS | 12,140 | 0.50 | -0.16 | 5.02 | 12,200 | 12,060 | 3,373 | 1,041 |
| ABC | 6,760 | -1.74 | -0.29 | -10.34 | 6,880 | 6,760 | 230,443 | 2,928 |
| PEPC | 2,550 | 0.00 | -1.54 | 5.37 | 2,680 | 2,540 | 1,580 | 191 |
| MJQE | 1,980 | 0.00 | 0.00 | -4.81 | 1,990 | 1,970 | 67,088 | 642 |
| CGSM | 2,440 | 0.00 | 0.41 | 0.41 | 2,440 | 2,420 | 27,234 | 4,781 |
| DBDE | 2,040 | 0.00 | 0.00 | -0.97 | 2,050 | 2,020 | 9,421 | 38 |
| JSL | 2,760 | 0.73 | 0.00 | -19.30 | 2,800 | 2,720 | 51,778 | 71 |
| 1D = 1 Day; 1M= 1 Month; MTD = Month-To-Date; YTD = Year-To-Date; Chg = Change; Vol = Volume; shr = share; Mkt cap = Market capitalization | ||||||||
Valuation Ratios
| EPS | BPS* | P/E | P/B | P/S | EV/EBITDA | ||
| ttm,mrq | (ttm,KHR) | KHR | (ttm,x) | (mrq,x) | (ttm,x) | (ttm,x) | |
| PPWSA | 2Q25 | 827 | 11,622 | 7.45 | 0.53 | 1.68 | 14.85 |
| GTI | 2Q25 | 29 | 7,023 | 245.02 | 1.02 | 0.87 | 40.09 |
| PPAP | 1Q25 | 2,951 | 22,115 | 4.57 | 0.61 | 1.57 | 3.94 |
| PPSP | 2Q25 | 735 | 4,376 | 2.79 | 0.47 | 0.94 | 2.07 |
| PAS | 1Q25 | 1,212 | 8,224 | 10.02 | 1.48 | 2.18 | 7.69 |
| ABC | 2Q25 | 1,460 | 14,410 | 4.63 | 0.47 | 0.81 | NA |
| PEPC* | 3Q25 | -1,445 | -1,303 | NA | NA | 3.05 | NA |
| MJQE | 2Q25 | 45 | 340 | 43.83 | 5.82 | 3.87 | 12.70 |
| CGSM | 2Q25 | 25 | 618 | 99.32 | 3.95 | 6.97 | 19.35 |
| JSL | 2Q25 | -82 | 492 | NA | 5.61 | 20.42 | 34.22 |
| DBDE | 2Q25 | 147 | 1,933 | 13.92 | 1.06 | 0.31 | 7.22 |
| NOTE: ttm= trailing-twelve months; mrq = most recent quarter; *FY ending in June, **excluding non-voting shares | |||||||
| Corporate Bonds |
Trading Summary
| Bond Symbol | Trading Vol (Units) | Trading Val (KHR'mn) | Latest Yield | Credit Rating | Bond Feature | Coupon Rate (%) | Days to Maturity |
| ABC32A | 0 | 0.0 | - - | khAA | Subordinated Bond | 8.50% | 2,293 |
| ABC32B | 0 | 0.0 | - - | KhAA | Subordinated Bond | 8.50% | 2,335 |
| ABC32C | 0 | 0.0 | - - | khAA | Subordinated Bond | 7.50% p.a. | 2,526 |
| CGSM33A | 0 | 0.0 | - - | KhAAA | Sustainability Bond | SOFR +3% or 5.5% per annum, whichever is higher | 2,955 |
| CIAF28A | 0 | 0.0 | - - | KhAAA | N/A | 6.30% Annually | 1,159 |
| CIAF30A | 0 | 0.0 | - - | KhAAA | Guaranteed Bond | 5.60% | 1,606 |
| GT27A | 0 | 0.0 | - - | N/A | Plain Bond, Green Bond | 7% per annum | 784 |
| PPSP29A | 0 | 0.0 | - - | KhAAA | Guaranteed Green Bond | Term SOFR + 1.5% | 1,346 |
| RRC32A | 0 | 0.0 | - - | N/A | Plain Bond | 7% Annually | 2,554 |
| RRGO27A | 0 | 0.0 | - - | KhAAA | Guaranteed Bond | SOFR+3,5% or 5% per annum (take which one is higher) | 801 |
| RRGT32B | 0 | 0.0 | - - | KhAAA | Guaranteed Bond | SOFR+3,5% or 5% per annum (take which one is higher) and Year 6 to Year 10: SOFR+3,75% or 5% per annum (take which one is higher) | 2,628 |
| SNTD40A | 0 | 0.0 | - - | N/A | Green Infrastructure Bond | 180-Day SOFR Average + 1.80% | 5,280 |
| SNTD40B | 0 | 0.0 | - - | N/A | Green Infrastructure Bond | 180-Day Average SOFR + 1.60% (4.00% - 6.00%) | 5,280 |
| Government Bonds |
Historical Issuance Summary
| 1 Y | 2 Y | 3 Y | 5 Y | 10 Y | |
| Total issuance ('K units) | 238.1 | 312.0 | 227.3 | 18.0 | 0.0 |
| Outstanding (KHR'bn) | 58.0 | 208.0 | 227.3 | 18.0 | 0.0 |
| Issuance ('K units, Latest) | 34.0 | 0.0 | 40.0 | 8.0 | 0.0 |
| Coupon rate (Latest) | 2.70% | 3.20% | 3.50% | 4.34% | 4.60% |
| Successful yield (Latest) | 3.25% | - | 4.30% | 5.00% | - |
| Latest bidding | 23-Apr-25 | 21-May-25 | 17-Sep-25 | 45,861 | 45,889 |
| *Total issuance is the accumulated issuance since September 2022; **Outstanding is aggregate principal value of government that remain outstanding; ***Successful yield: mid yields are shown if multiple price auction method was adopted. | |||||
| Stock Charts |
Main Board
Growth Board