Cambodia's 5.9% GDP growth in 1H2025 led by manufacturing surge
| News Highlights |
Economy and Industry
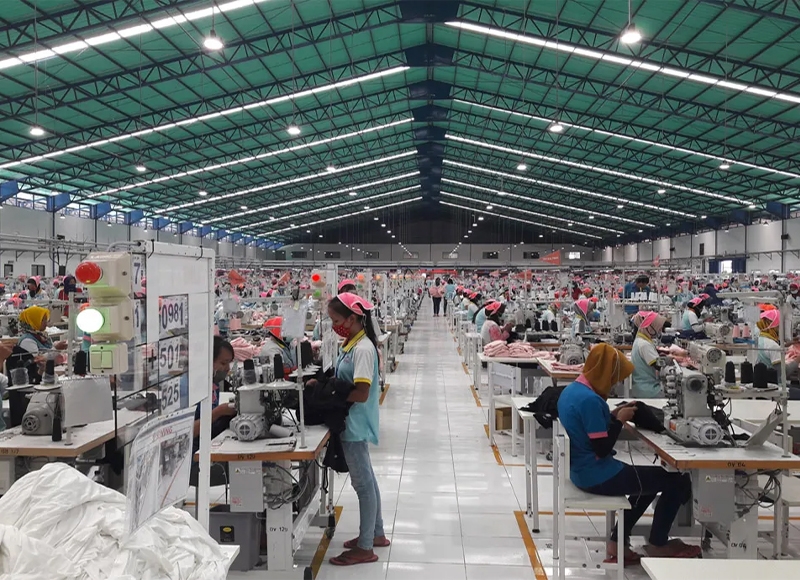
Cambodia's 5.9% GDP growth in 1H2025 led by manufacturing surge Cambodia's economy grew by 5.9% in the first half of 2025, largely due to the manufacturing sector, particularly garment exports, despite external challenges, according to the National Bank of Cambodia (NBC)'s report for the first half of 2025. The growth was supported by tourism and agriculture, while construction and real estate sectors remain weak. Garment manufacturing grew 10.4% between January and June, compared to the 8.5% expansion seen in non-garment manufacturing. Exports of manufactured products rose by 15.3% in the first half of 2025 compared to 8.7% in the same period last year. The tourism sector saw a 6.2% increase in international visitor numbers to 3.4 million, while domestic visitors saw a 50.3% increase to 14.6 million. The agricultural sector grew by 1.2% on the back of increased crop and fishery yields. The construction sector grew 0.7%, but foreign direct investment in the sector fell 14% in the first half. The real estate sector grew at a low rate of 0.8% due to a decline in housing prices and credit volume. (Source: Kiripost)
Cambodia's SME loan portfolio surpasses $35 billion in Q2 In Q2 2021, Cambodia's Small Business Credit Performance slightly weakened, with the number of active loan accounts declining by 1.2% to 1.79 million. However, the total loan balance grew by 0.8% to $35.54 billion, reflecting a market with larger borrowing volumes per account and ongoing credit activity in core economic sectors. The decline was pronounced in key loan categories like Asset Finance, Working Capital, Agriculture, and Other, reflecting more cautious borrowing behavior among enterprises. Construction credit applications saw a modest increase by 4.4%, with the Tonle Sap region driving growth. The Working Capital segment dominated the consumer credit landscape, accounting for over half of all loan accounts and two-thirds of the total outstanding loan balance. However, the quality of credit weakened, with construction loans recording the highest delinquency rate. The outlook for credit activity in Cambodia remains cautiously optimistic for the second half of the year. (Source: Khmer Times)
Finance Ministry clarifies 0% tariff on U.S. imports applies only to new goods Cambodia has clarified the 0% customs duties on US goods, which were part of recent reciprocal tariff negotiations, will only apply to new goods. Existing import duties will still apply to used US goods, such as motor vehicles. The Ministry of Economy and Finance spokesperson, Meas Sok Sensan, clarified that the 0% rate does not apply to used vehicles from the US. Potential US imports include cars, auto parts, machinery, pharmaceuticals, medical supplies, animal and agricultural products, and construction materials. Cambodia's main exports to the US include garments, footwear, travel goods, bicycles, bicycle tires, and agricultural products. The US administration initially reduced the rate to 36% and finally to 19% after extensive bilateral negotiations. Cambodia is now viewed as one of the most successful countries in negotiating trade terms with the US, which is expected to boost exports to the US and enhance its potential to attract more foreign direct investment in the future. (Source: The Phnom Penh Post)
Corporate News
ABA and CGCC collaborate on credit guarantee programs ABA Bank and the Credit Guarantee Corporation of Cambodia (CGCC) have signed two credit guarantee agreements, demonstrating their commitment to supporting businesses, particularly small and medium enterprises in Cambodia. Under the Economic Stimulus Guarantee Scheme (ESGS), CGCC can provide guarantees on loans disbursed by ABA to eligible businesses with coverage up to 90% and a guarantee fee as low as 0.75%. Under the Rice Export Guarantee Scheme Phase 2 (REGS), CGCC offers loan support to rice exporters and millers that lack collateral, enhancing the competitiveness of Cambodian rice in international markets. As of 31 July 2025, approximately USD 38 million in loans have been disbursed with CGCC's guarantees under REGS. (Source: Kiripost)
Stock Market
CSX index inches up 0.04% amid mixed main board performance On 08 August 2025, the CSX Index was up by 0.04%, closing at 404.8 points. On the Main Board, PWSA (+0.32%), ABC (+0.29%), and PAS (+0.17%) posted gains, while PEPC (-1.88%), MJQE (-0.50%), and PPSP (-0.48%) recorded losses. GTI, PPAP, and CGSM remained unchanged. On the Growth Board, DBDE was up by 0.50%, while JSL remained unchanged. Total trading volume reached 26,033 shares, with a turnover of KHR 121 million. (Source: YSC Research)
| CSX Stocks |
CSX Index
| Value | 1D % Chg | 1D Vol | Mkt Cap (KHR'bn) |
| 404.83 | 0.04 | 26,033 | 10,858 |
Stock Performance
| Stock | Close (KHR) | 1D chg (%) | MTD chg (%) | YTD chg (%) | 1M high (KHR) | 1M low (KHR) | MTD vol (shr) | Mkt cap (KHR'bn) |
| PWSA | 6,180 | 0.32 | 0.00 | -2.83 | 6,220 | 6,160 | 28,121 | 537 |
| GTI | 6,760 | 0.00 | 2.42 | 33.07 | 6,780 | 6,000 | 23,985 | 270 |
| PPAP | 13,520 | 0.00 | 0.00 | -2.31 | 13,840 | 13,320 | 1,493 | 280 |
| PPSP | 2,090 | -0.48 | -1.42 | -3.69 | 2,130 | 2,090 | 218,891 | 150 |
| PAS | 12,020 | 0.17 | -0.66 | 3.98 | 12,160 | 11,960 | 3,554 | 1,031 |
| ABC | 6,860 | 0.29 | -0.58 | -9.02 | 6,920 | 6,840 | 73,117 | 2,971 |
| PEPC | 2,610 | -1.88 | -3.33 | 9.21 | 2,710 | 2,560 | 251 | 196 |
| MJQE | 1,980 | -0.50 | -0.50 | -4.81 | 2,000 | 1,980 | 53,126 | 642 |
| CGSM | 2,440 | 0.00 | 0.00 | 0.41 | 2,440 | 2,430 | 12,119 | 4,781 |
| DBDE | 2,010 | 0.50 | 0.00 | -2.43 | 2,030 | 2,000 | 13,721 | 37 |
| JSL | 2,790 | 0.00 | 0.36 | -18.42 | 2,810 | 2,690 | 1,420 | 72 |
| 1D = 1 Day; 1M= 1 Month; MTD = Month-To-Date; YTD = Year-To-Date; Chg = Change; Vol = Volume; shr = share; Mkt cap = Market capitalization | ||||||||
Valuation Ratios
| EPS | BPS* | P/E | P/B | P/S | EV/EBITDA | ||
| ttm,mrq | (ttm,KHR) | KHR | (ttm,x) | (mrq,x) | (ttm,x) | (ttm,x) | |
| PPWSA | 1Q25 | 665 | 11,199 | 9.30 | 0.55 | 1.66 | 15.44 |
| GTI | 1Q25 | 55 | 7,057 | 122.35 | 0.96 | 0.82 | 41.62 |
| PPAP | 1Q25 | 2,951 | 22,115 | 4.58 | 0.61 | 1.57 | 3.95 |
| PPSP | 1Q25 | 468 | 3,866 | 4.46 | 0.54 | 1.50 | 4.35 |
| PAS | 1Q25 | 1,212 | 8,224 | 9.92 | 1.46 | 8.71 | 7.63 |
| ABC | 1Q25 | 544 | 13,790 | 12.61 | 0.50 | 4.34 | NA |
| PEPC* | 1Q25 | -88 | -17 | NA | -151.63 | 12.95 | NA |
| MJQE | 4Q24 | 37 | 307 | 53.34 | 6.45 | 3.91 | 11.91 |
| CGSM | 1Q25 | 26 | 606 | 92.74 | 4.02 | 6.92 | 16.66 |
| JSL | 1Q25 | -8 | 685 | NA | 4.07 | 7.50 | 28.66 |
| DBDE | 1Q25 | -12 | 1,840 | NA | 1.09 | 0.40 | 74.07 |
| NOTE: ttm= trailing-twelve months; mrq = most recent quarter; *FY ending in June, **excluding non-voting shares | |||||||
| Corporate Bonds |
Trading Summary
| Bond Symbol | Trading Vol (Units) | Trading Val (KHR'mn) | Latest Yield | Credit Rating | Bond Feature | Coupon Rate (%) | Days to Maturity |
| ABC32A | 0 | 0.0 | - - | khAA | Subordinated Bond | 8.50% | 2,359 |
| ABC32B | 0 | 0.0 | - - | KhAA | Subordinated Bond | 8.50% | 2,401 |
| CGSM33A | 0 | 0.0 | - - | KhAAA | Sustainability Bond | SOFR +3% or 5.5% per annum, whichever is higher | 3,021 |
| CIAF28A | 0 | 0.0 | - - | KhAAA | N/A | 6.30% Annually | 1,225 |
| CIAF30A | 0 | 0.0 | - - | KhAAA | Guaranteed Bond | 5.60% | 1,672 |
| GT27A | 0 | 0.0 | - - | N/A | Plain Bond, Green Bond | 7% per annum | 850 |
| PPSP29A | 0 | 0.0 | - - | KhAAA | Guaranteed Green Bond | Term SOFR + 1.5% | 1,412 |
| RRC32A | 0 | 0.0 | - - | N/A | Plain Bond | 7% Annually | 2,620 |
| RRGO27A | 0 | 0.0 | - - | KhAAA | Guaranteed Bond | SOFR+3,5% or 5% per annum (take which one is higher) | 867 |
| RRGT32B | 0 | 0.0 | - - | KhAAA | Guaranteed Bond | SOFR+3,5% or 5% per annum (take which one is higher) and Year 6 to Year 10: SOFR+3,75% or 5% per annum (take which one is higher) | 2,694 |
| SNTD40A | 0 | 0.0 | - - | N/A | Green Infrastructure Bond | 180-Day SOFR Average + 1.80% | 5,346 |
| SNTD40B | 0 | 0.0 | - - | N/A | Green Infrastructure Bond | 180-Day Average SOFR + 1.60% (4.00% - 6.00%) | 5,346 |
| SNTD40C | 0 | 0.0 | - - | N/A | Green Infrastructure Bond | 180-Day SOFR Average + 3.00% | 5,346 |
| Government Bonds |
Historical Issuance Summary
| 1 Y | 2 Y | 3 Y | 5 Y | 10 Y | |
| Total issuance ('K units) | 238.1 | 312.0 | 187.3 | 18.0 | 0.0 |
| Outstanding (KHR'bn) | 0.0 | 0.0 | 0.0 | 0.0 | 0.0 |
| Issuance ('K units, Latest) | 34.0 | 0.0 | 12.0 | 8.0 | 0.0 |
| Coupon rate (Latest) | 2.70% | 3.20% | 3.50% | 4.34% | 5.25% |
| Successful yield (Latest) | 3.25% | - | 3.50% | 5.00% | - |
| Latest bidding | 23-Apr-25 | 21-May-25 | 25-Jun-25 | 45,861 | 45,525 |
| *Total issuance is the accumulated issuance since September 2022; **Outstanding is aggregate principal value of government that remain outstanding; ***Successful yield: mid yields are shown if multiple price auction method was adopted. | |||||
| Stock Charts |
Main Board
Growth Board