Cambodia’s mining sector saw an 80% surge in non-tax revenue in 2024
| News Highlights |
Economy and Industry
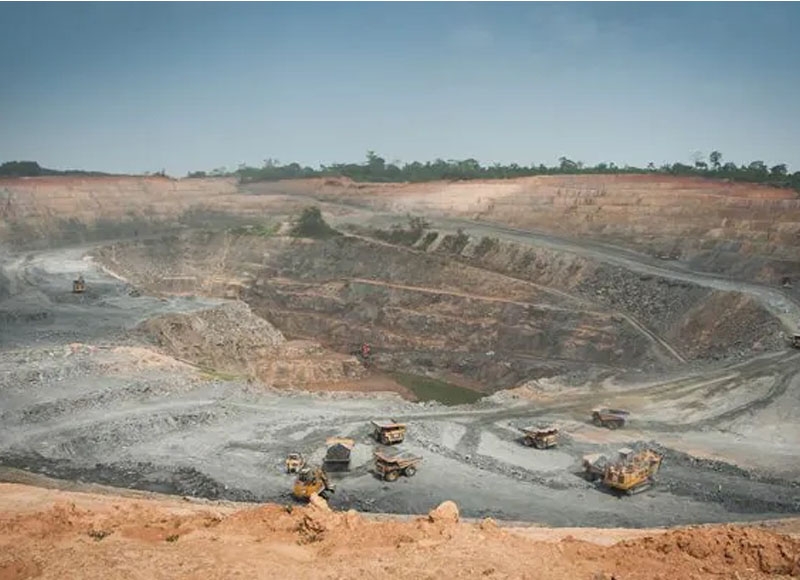
Cambodia’s mining sector saw an 80% surge in non-tax revenue in 2024 Cambodia's mining sector has seen a 79% increase in non-tax revenue in 2024, according to Minister of Mines and Energy Keo Rattanak. The mining sector in Kampong Speu province generated over $5 million in 2024 and around $1 million in the first quarter of 2025, creating 1,900 direct jobs. The country has attracted both local and foreign investors, generating new income sources. The government aims to collect around $7.9 billion in national revenue in 2025, with the increase reflecting the growing number of mining operations and investor returns. Economist Hong Vanak believes further exploration and operations in line with legal frameworks will ensure sustainable revenue growth. (Source: Khmer Times)
Cambodia moves to net cement producer role after factory launch Cambodia has opened its sixth cement factory, eliminating the need for cement imports. The facility, a $250 million investment by Conch KT Cement, is located in Kampong Speu's Oral district. With a production capacity of 2.2 million tonnes per year, the factory is expected to create over 1,000 jobs and meet the growing demand for residential and commercial buildings and infrastructure development. Prime Minister Hun Manet expressed pride at the launch and encouraged investors to continue expanding investments in Cambodia, highlighting the country's accelerating development. He also urged the Ministry of Mines and Energy and the Cambodia Cement Manufacturing Association to seek international markets to promote the export of Cambodian cement. As of 2025, Cambodia has six cement factories with a total investment of $1.111 billion, employing around 3,000 workers. (Source: Phnom Penh Post)
Despite global uncertainties, Cambodia keeps drawing record investment levels Cambodia continues to attract record investments despite global uncertainties, driven by political and macroeconomic stability. In the first four months of 2025, the government approved 231 projects worth $3.4 billion, up 103 projects from 2024. Economic diplomacy is strengthening Cambodia's global integration, supporting its Vision 2050 goal of becoming a high-income nation. The government emphasizes peace and stability as crucial factors for sustained growth. Officials highlight careful fiscal management, leading to increased national revenue and a cash surplus. Additionally, Cambodia's strategic focus on foreign direct investment is boosting key sectors like agriculture and economy. Strengthened bilateral and multilateral cooperation is further expanding market access for Cambodian products. (Source: Khmer Times)
Corporate News
CDC Partners with ACLEDA to Improve Digital Payment for Public Services The Council for the Development of Cambodia (CDC) and ACLEDA Bank have signed a Memorandum of Understanding to improve public service fee collection in the country. The agreement aims to enhance efficiency and transparency through the CDC's Online Service Payment system (cdcOSP), which has contributed 35% of the CDC's total revenue collection in the last nine months. The agreement demonstrates a step towards strengthening partnerships between the public and private sectors and supports national economic development. The cdcOSP payment system will enable investors to pay public fees more quickly and efficiently, contributing to attracting investors, providing job opportunities, boosting competitiveness, and fostering economic progress in Cambodia. (Source: Kiripost)
Stock Market
CSX index holds steady as trading volume surpasses 626k shares On 21 May 2025, the CSX Index remained unchanged, closing at 407.3 points. On the Main Board, GTI (+1.00%), PPSP (+0.47%), and CGSM (+0.41%) led the gainers, while PEPC (-1.43%), ABC (-0.57%), and MJQE (-0.50%) recorded losses. PWSA, PPAP, and PAS remained unchanged. On the Growth Board, DBDE remained flat, while JSL declined by 2.12%. Total trading volume reached 626,634 shares, with a turnover of KHR 1,487 million. (Source: YSC Research)
| CSX Stocks |
CSX Index
| Value | 1D % Chg | 1D Vol | Mkt Cap (KHR'bn) |
| 407.26 | 0.00 | 626,634 | 10,923 |
Stock Performance
| Stock | Close (KHR) | 1D chg (%) | MTD chg (%) | YTD chg (%) | 1M high (KHR) | 1M low (KHR) | MTD vol (shr) | Mkt cap (KHR'bn) |
| PWSA | 6,320 | 0.00 | 0.00 | -0.63 | 6,340 | 6,260 | 57,849 | 550 |
| GTI | 8,100 | 1.00 | 14.08 | 59.45 | 8,100 | 6,480 | 136,413 | 324 |
| PPAP | 13,920 | 0.00 | -1.14 | 0.58 | 14,200 | 13,920 | 6,513 | 288 |
| PPSP | 2,130 | 0.47 | 0.95 | -1.84 | 2,130 | 2,100 | 644,618 | 153 |
| PAS | 11,800 | 0.00 | -1.34 | 2.08 | 12,000 | 11,800 | 6,447 | 1,012 |
| ABC | 6,920 | -0.57 | -2.81 | -8.22 | 7,160 | 6,860 | 630,576 | 2,997 |
| PEPC | 2,750 | -1.43 | 4.96 | 15.06 | 2,810 | 2,550 | 1,580 | 206 |
| MJQE | 2,010 | -0.50 | -8.22 | -3.37 | 2,190 | 2,010 | 291,200 | 651 |
| CGSM | 2,420 | 0.41 | 0.00 | -0.41 | 2,430 | 2,400 | 57,627 | 4,741 |
| DBDE | 2,110 | 0.00 | 0.48 | 2.43 | 2,110 | 2,090 | 33,196 | 39 |
| JSL | 2,770 | -2.12 | -12.89 | -19.01 | 3,440 | 2,720 | 23,607 | 71 |
| 1D = 1 Day; 1M= 1 Month; MTD = Month-To-Date; YTD = Year-To-Date; Chg = Change; Vol = Volume; shr = share; Mkt cap = Market capitalization | ||||||||
Valuation Ratios
| EPS | BPS* | P/E | P/B | P/S | EV/EBITDA | ||
| ttm,mrq | (ttm,KHR) | KHR | (ttm,x) | (mrq,x) | (ttm,x) | (ttm,x) | |
| PPWSA | 4Q24 | 978 | 11,199 | 6.46 | 0.56 | 1.73 | 13.23 |
| GTI | 4Q24 | 48 | 7,057 | 168.75 | 1.15 | 0.96 | 28.75 |
| PPAP | 4Q24 | 2,550 | 22,115 | 5.46 | 0.63 | 1.70 | 3.43 |
| PPSP | 4Q24 | 220 | 3,866 | 9.70 | 0.55 | 2.88 | 5.08 |
| PAS | 4Q24 | 1,478 | 8,224 | 7.99 | 1.43 | 2.20 | 7.91 |
| ABC | 4Q24 | 1,140 | 13,790 | 6.07 | 0.50 | 0.92 | NA |
| PEPC* | 1Q25 | -1,009 | -17 | NA | -159.77 | 4.81 | NA |
| MJQE | 4Q24 | 37 | 307 | 54.14 | 6.55 | 3.97 | 12.08 |
| CGSM | 4Q24 | 52 | 606 | 46.52 | 3.99 | 6.76 | 16.05 |
| JSL | 4Q24 | 14 | 685 | 197.82 | 4.04 | 3.96 | 17.94 |
| DBDE | 4Q24 | 23 | 1,840 | 92.31 | 1.15 | 0.55 | 8.33 |
| NOTE: ttm= trailing-twelve months; mrq = most recent quarter; *FY ending in June, **excluding non-voting shares | |||||||
| Corporate Bonds |
Trading Summary
| Bond Symbol | Trading Vol (Units) | Trading Val (KHR'mn) | Latest Yield | Credit Rating | Bond Feature | Coupon Rate (%) | Days to Maturity |
| ABC32A | 0 | 0.0 | - - | khAA | Subordinated Bond | 8.50% | 2,438 |
| ABC32B | 0 | 0.0 | - - | KhAA | Subordinated Bond | 8.50% | 2,480 |
| CGSM33A | 0 | 0.0 | - - | KhAAA | Sustainability Bond | SOFR +3% or 5.5% per annum, whichever is higher | 3,100 |
| CIAF28A | 0 | 0.0 | - - | KhAAA | N/A | 6.30% Annually | 1,304 |
| CIAF30A | 0 | 0.0 | - - | KhAAA | Guaranteed Bond | 5.60% | 1,751 |
| GT27A | 0 | 0.0 | - - | N/A | Plain Bond, Green Bond | 7% per annum | 929 |
| PPSP29A | 0 | 0.0 | - - | KhAAA | Guaranteed Green Bond | Term SOFR + 1.5% | 1,491 |
| RRC32A | 0 | 0.0 | - - | N/A | Plain Bond | 7% Annually | 2,699 |
| RRGO27A | 0 | 0.0 | - - | KhAAA | Guaranteed Bond | SOFR+3,5% or 5% per annum (take which one is higher) | 946 |
| RRGT32B | 0 | 0.0 | - - | KhAAA | Guaranteed Bond | SOFR+3,5% or 5% per annum (take which one is higher) and Year 6 to Year 10: SOFR+3,75% or 5% per annum (take which one is higher) | 2,773 |
| SNTD40A | 0 | 0.0 | - - | N/A | Green Infrastructure Bond | 180-Day SOFR Average + 1.80% | 5,425 |
| SNTD40B | 0 | 0.0 | - - | N/A | Green Infrastructure Bond | 180-Day Average SOFR + 1.60% (4.00% - 6.00%) | 5,425 |
| SNTD40C | 0 | 0.0 | - - | N/A | Green Infrastructure Bond | 180-Day SOFR Average + 3.00% | 5,425 |
| Government Bonds |
Historical Issuance Summary
| 1 Y | 2 Y | 3 Y | 5 Y | 10 Y | |
| Total issuance ('K units) | 238.1 | 312.0 | 175.3 | 10.0 | 0.0 |
| Outstanding (KHR'bn) | 0.0 | 0.0 | 0.0 | 0.0 | 0.0 |
| Issuance ('K units, Latest) | 34.0 | 0.0 | 90.0 | 0.0 | 0.0 |
| Coupon rate (Latest) | 2.70% | 3.20% | 3.50% | 4.75% | 5.25% |
| Successful yield (Latest) | 3.25% | - | 4.25% | - | - |
| Latest bidding | 23-Apr-25 | 19-Feb-25 | 19-Mar-25 | 45,581 | 45,525 |
| *Total issuance is the accumulated issuance since September 2022; **Outstanding is aggregate principal value of government that remain outstanding; ***Successful yield: mid yields are shown if multiple price auction method was adopted. | |||||
| Stock Charts |
Main Board
Growth Board