Cambodia-China trade volume hits $5.6 billion in first four months of 2025
| News Highlights |
Economy and Industry
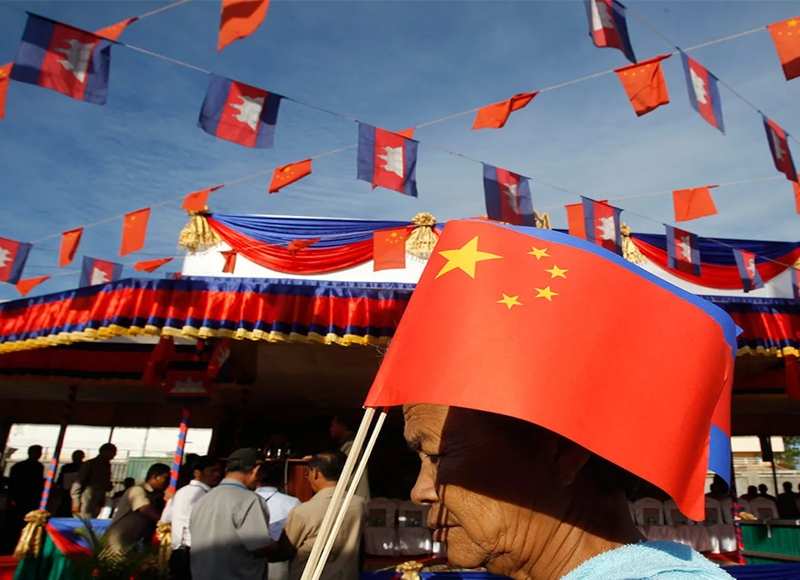
Cambodia-China trade volume hits $5.6 billion in first four months of 2025 Cambodia's bilateral trade with China surged past $5.69 billion in the first four months of 2025, marking a 27% increase compared to the same period last year ($4.48 billion). However, Cambodia's exports to China saw a slight YoY decline of 1.7%, totaling $478.63 million, while imports from China rose significantly by 30.5% YoY, reaching $5.21 billion. This data underscores the deepening economic ties between the two nations, with China remaining one of Cambodia's largest trading partners and a key source of consumer goods, raw materials, and industrial equipment. Despite the rising trade volume, Cambodia continues to face a trade deficit with China, largely due to its role as a low-cost production hub. To address this imbalance, Cambodia is encouraged to diversify its trade routes and invest in strengthening domestic supply chains. The uptick in trade is driven by enhanced bilateral cooperation under the Regional Comprehensive Economic Partnership (RCEP) and the Cambodia-China Free Trade Agreement (CCFTA), both of which came into effect in 2022. (Source: Khmer Times)
Cambodian Riel now usable for cross-border payments in four nations Cambodians can now make cross-border payments in Thailand, Vietnam, Laos, and Malaysia by scanning QR codes using the Khmer Riel (KHR), without the need to convert to US dollars. Deputy Governor of the National Bank of Cambodia, Yim Leat, announced the new system during a ceremony celebrating the 45th anniversary of the re-circulation of the Riel. The Bakong system enables fast and secure electronic transactions, while the KHQR system, introduced in July 2022, has facilitated cross-border QR payment scanning among banking and financial institutions. To promote the use of the Riel in digital payments, the central bank organized a campaign highlighting the benefits of using the local currency within the existing payment infrastructure. The issuance of new banknotes is aligned with economic growth and efforts to enhance currency security. (Source: Khmer Times)
Leading Japanese consulting firm encouraged to support SEZ expansion The Council for the Development of Cambodia (CDC) has proposed the establishment of a new Special Economic Zone (SEZ) to attract Japanese investment and businesses. The proposal was presented during a meeting between the CDC and a delegation from the Japan Development Institute (JDI). The CDC aims to diversify industrial activities and draw in investment capital as part of the Royal Government of Cambodia's industrial development strategy, which seeks to encourage both local and foreign investors to establish factories and industrial operations within SEZs across the country. Additionally, the CDC is focusing on transforming Preah Sihanouk Province into a multi-purpose SEZ. (Source: Khmer Times)
Corporate News
The Royal Group SEZs provide employment opportunities to over 50,000 workers Royal Group Phnom Penh SEZ Plc (PPSP) has reached a significant milestone in its growth, with its two Special Economic Zones—Royal Group Phnom Penh Special Economic Zone (RGPPSEZ) and Royal Group Kandal Special Economic Zone (RGKSEZ) - employing a combined total of over 50,000 people. The RGPPSEZ currently employs 48,730 workers, while the RGKSEZ, developed by Royal Group Kandal SEZ Co., Ltd., employs 2,016 workers, bringing the total to 50,746. The two SEZs host 117 companies from 14 countries, representing a wide range of manufacturing activities. In the first quarter of 2025, exports from the zones reached $431 million, marking an 8.6% increase compared to the same period in 2024. These zones have become vital engines of job creation and industrial transformation, playing a key role in Cambodia's economic development. The Group remains committed to delivering high-quality services to investors and creating more employment opportunities for the Cambodian people. (Source: Khmer Times)
Stock Market
CSX index dips 0.30% amid mixed stock performance On 19 May 2025, the CSX Index declined by 0.30%, closing at 405.6 points. On the Main Board, GTI (+5.41%) and PPSP (+0.47%) led the gainers, while PEPC (-6.81%), PPAP (-0.57%), PAS (-0.50%), CGSM (-0.41%), and ABC (-0.29%) posted losses. PWSA and MJQE remained unchanged. On the Growth Board, DBDE remained unchanged, while JSL rose by 5.88%. Total trading volume reached 51,602 shares, with a turnover of KHR 287 million. (Source: YSC Research)
| CSX Stocks |
CSX Index
| Value | 1D % Chg | 1D Vol | Mkt Cap (KHR'bn) |
| 405.64 | -0.30 | 51,602 | 10,880 |
Stock Performance
| Stock | Close (KHR) | 1D chg (%) | MTD chg (%) | YTD chg (%) | 1M high (KHR) | 1M low (KHR) | MTD vol (shr) | Mkt cap (KHR'bn) |
| PWSA | 6,320 | 0.00 | 0.00 | -0.63 | 6,340 | 6,260 | 52,274 | 550 |
| GTI | 7,800 | 5.41 | 9.86 | 53.54 | 7,800 | 6,480 | 125,676 | 312 |
| PPAP | 13,940 | -0.57 | -0.99 | 0.72 | 14,200 | 13,900 | 5,164 | 288 |
| PPSP | 2,120 | 0.47 | 0.47 | -2.30 | 2,150 | 2,100 | 56,025 | 152 |
| PAS | 11,860 | -0.50 | -0.84 | 2.60 | 12,000 | 11,840 | 4,470 | 1,017 |
| ABC | 6,900 | -0.29 | -3.09 | -8.49 | 7,160 | 6,860 | 497,735 | 2,989 |
| PEPC | 2,600 | -6.81 | -0.76 | 8.79 | 2,810 | 2,550 | 1,417 | 195 |
| MJQE | 2,020 | 0.00 | -7.76 | -2.88 | 2,190 | 2,020 | 271,480 | 655 |
| CGSM | 2,410 | -0.41 | -0.41 | -0.82 | 2,430 | 2,400 | 40,009 | 4,722 |
| DBDE | 2,110 | 0.00 | 0.48 | 2.43 | 2,110 | 2,090 | 31,781 | 39 |
| JSL | 2,880 | 5.88 | -9.43 | -15.79 | 3,440 | 2,720 | 17,595 | 74 |
| 1D = 1 Day; 1M= 1 Month; MTD = Month-To-Date; YTD = Year-To-Date; Chg = Change; Vol = Volume; shr = share; Mkt cap = Market capitalization | ||||||||
Valuation Ratios
| EPS | BPS* | P/E | P/B | P/S | EV/EBITDA | ||
| ttm,mrq | (ttm,KHR) | KHR | (ttm,x) | (mrq,x) | (ttm,x) | (ttm,x) | |
| PPWSA | 4Q24 | 978 | 11,199 | 6.46 | 0.56 | 1.73 | 13.23 |
| GTI | 4Q24 | 48 | 7,057 | 162.50 | 1.11 | 0.93 | 27.91 |
| PPAP | 4Q24 | 2,550 | 22,115 | 5.47 | 0.63 | 1.70 | 3.43 |
| PPSP | 4Q24 | 220 | 3,866 | 9.65 | 0.55 | 2.87 | 5.06 |
| PAS | 4Q24 | 1,478 | 8,224 | 8.03 | 1.44 | 2.22 | 7.94 |
| ABC | 4Q24 | 1,140 | 13,790 | 6.05 | 0.50 | 0.91 | NA |
| PEPC* | 1Q25 | -1,009 | -17 | NA | -151.05 | 4.54 | NA |
| MJQE | 4Q24 | 37 | 307 | 54.41 | 6.58 | 3.99 | 12.14 |
| CGSM | 4Q24 | 52 | 606 | 46.33 | 3.97 | 6.74 | 15.99 |
| JSL | 4Q24 | 14 | 685 | 205.68 | 4.20 | 4.12 | 18.34 |
| DBDE | 4Q24 | 23 | 1,840 | 92.31 | 1.15 | 0.55 | 8.33 |
| NOTE: ttm= trailing-twelve months; mrq = most recent quarter; *FY ending in June, **excluding non-voting shares | |||||||
| Corporate Bonds |
Trading Summary
| Bond Symbol | Trading Vol (Units) | Trading Val (KHR'mn) | Latest Yield | Credit Rating | Bond Feature | Coupon Rate (%) | Days to Maturity |
| ABC32A | 0 | 0.0 | - - | khAA | Subordinated Bond | 8.50% | 2,440 |
| ABC32B | 0 | 0.0 | - - | KhAA | Subordinated Bond | 8.50% | 2,482 |
| CGSM33A | 0 | 0.0 | - - | KhAAA | Sustainability Bond | SOFR +3% or 5.5% per annum, whichever is higher | 3,102 |
| CIAF28A | 0 | 0.0 | - - | KhAAA | N/A | 6.30% Annually | 1,306 |
| CIAF30A | 0 | 0.0 | - - | KhAAA | Guaranteed Bond | 5.60% | 1,753 |
| GT27A | 0 | 0.0 | - - | N/A | Plain Bond, Green Bond | 7% per annum | 931 |
| PPSP29A | 0 | 0.0 | - - | KhAAA | Guaranteed Green Bond | Term SOFR + 1.5% | 1,493 |
| RRC32A | 0 | 0.0 | - - | N/A | Plain Bond | 7% Annually | 2,701 |
| RRGO27A | 0 | 0.0 | - - | KhAAA | Guaranteed Bond | SOFR+3,5% or 5% per annum (take which one is higher) | 948 |
| RRGT32B | 0 | 0.0 | - - | KhAAA | Guaranteed Bond | SOFR+3,5% or 5% per annum (take which one is higher) and Year 6 to Year 10: SOFR+3,75% or 5% per annum (take which one is higher) | 2,775 |
| SNTD40A | 0 | 0.0 | - - | N/A | Green Infrastructure Bond | 180-Day SOFR Average + 1.80% | 5,427 |
| SNTD40B | 0 | 0.0 | - - | N/A | Green Infrastructure Bond | 180-Day Average SOFR + 1.60% (4.00% - 6.00%) | 5,427 |
| SNTD40C | 0 | 0.0 | - - | N/A | Green Infrastructure Bond | 180-Day SOFR Average + 3.00% | 5,427 |
| Government Bonds |
Historical Issuance Summary
| 1 Y | 2 Y | 3 Y | 5 Y | 10 Y | |
| Total issuance ('K units) | 238.1 | 312.0 | 175.3 | 10.0 | 0.0 |
| Outstanding (KHR'bn) | 0.0 | 0.0 | 0.0 | 0.0 | 0.0 |
| Issuance ('K units, Latest) | 34.0 | 0.0 | 90.0 | 0.0 | 0.0 |
| Coupon rate (Latest) | 2.70% | 3.20% | 3.50% | 4.75% | 5.25% |
| Successful yield (Latest) | 3.25% | - | 4.25% | - | - |
| Latest bidding | 23-Apr-25 | 19-Feb-25 | 19-Mar-25 | 45,581 | 45,525 |
| *Total issuance is the accumulated issuance since September 2022; **Outstanding is aggregate principal value of government that remain outstanding; ***Successful yield: mid yields are shown if multiple price auction method was adopted. | |||||
| Stock Charts |
Main Board
Growth Board