Rice exports generate significant revenue for Cambodia
| News Highlights |
Economy and Industry
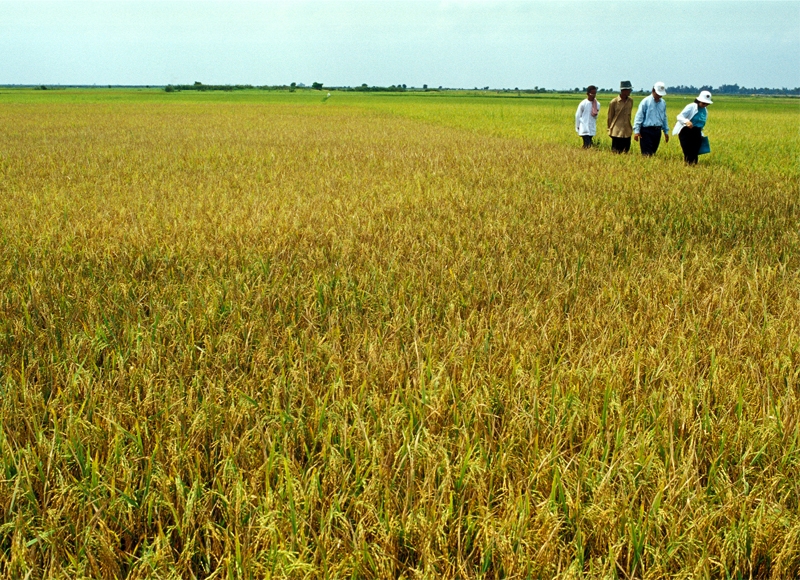
Rice exports generate significant revenue for Cambodia In the first two months of 2025, Cambodia's rice exports generated $420 million, showcasing the sector's robust performance. Milled rice in particular saw a rise of nearly 50% in terms of exported tonnage and 62% int terms of value while rice paddy exports saw a reduction of 20% in terms of export value at the same time. Fragrant rice, a premium product, remains the flagship export, catering to high-demand markets such as China, Europe, and regional neighbors. To capitalize on this success, efforts are being made to improve cultivation techniques, enhance the quality of rice, and expand its reach to untapped markets. The government and private sector are working collaboratively to address logistical challenges and increase production efficiency. (Source: Khmer Times)
Cambodia faces challenges with LDC graduation As Cambodia progresses towards graduating from the Least Developed Country (LDC) status by 2029, it faces potential economic challenges. While this milestone reflects its socio-economic development, the loss of preferential trade benefits and access to international support measures may reduce annual growth by around 1.5%. Key export industries, especially textiles and garments, could be impacted as tariff-free trade benefits diminish. To counteract these effects, the Cambodian government is crafting strategies to ensure a smooth transition and maintain economic stability. Policymakers emphasize the need to boost competitiveness, diversify exports, and strengthen trade agreements to sustain growth. (Source: Khmer Times)
Cambodia's growing exports to the United States Cambodia's exports to the US experienced a remarkable 25% increase during the first two months of 2025, reaching over $1.6 billion with the second and third biggest market being Vietnam and Japan, respectively. This growth highlights the strength of the bilateral trade relationship, with textiles, apparel, and footwear being the dominant export categories. The steady demand for Cambodian products in the US market not only underscores their competitiveness but also reflects effective trade policies. However, experts have highlighted the importance of diversifying export products to reduce dependency on a single category and enhance economic resilience. Initiatives are underway to explore new sectors, including electronics and agricultural goods, to broaden the export portfolio. (Source: Khmer Times)
Corporate News
Phnom Penh Port's significant expansion in cargo traffic The Phnom Penh Autonomous Port (PPAP) achieved an impressive 31% growth in cargo and container vessel traffic in the first two months of 2025, indicating a surge in both domestic demand and export activities. This growth can be attributed to ongoing infrastructure improvements and modernization efforts aimed at enhancing the port's capacity and operational efficiency. The port serves as a critical trade hub, facilitating the seamless movement of goods for both local industries and international markets. In response to rising demand, plans are being developed to further expand the port's facilities and introduce advanced technologies to streamline processes. This sustained growth not only underscores the port's importance to Cambodia's economy but also reflects the country's commitment to supporting trade and attracting foreign investment through improved logistics and connectivity. (Source: Cambodian Investment Review)
Stock Market
CSX index rises 0.25% amid mixed stock performance The CSX index was up by 0.25%, closing at 412.4 points. On the main board, PPSP (+0.47%) and CGSM (+0.41%) posted gains, while PEPC (-2.70%) and PPAP (-0.29%) recorded losses. PWSA, GTI, and PAS remained unchanged. On the growth board, DBDE also remained unchanged, while JSL increased by 0.99%. The session recorded a total trading volume of 29,237 shares, with a turnover of KHR 187 million. (Source: YSC Research)
| CSX Stocks |
CSX Index
| Value | 1D % Chg | 1D Vol | Mkt Cap (KHR'bn) |
| 413.39 | 0.24 | 29,237 | 11,088 |
Stock Performance
| Stock | Close (KHR) | 1D chg (%) | MTD chg (%) | YTD chg (%) | 1M high (KHR) | 1M low (KHR) | MTD vol (shr) | Mkt cap (KHR'bn) |
| PWSA | 6,340 | 0.00 | 0.96 | -0.31 | 6,360 | 6,240 | 61,177 | 551 |
| GTI | 6,060 | 0.00 | 0.33 | 19.29 | 6,140 | 6,020 | 41,520 | 242 |
| PPAP | 13,980 | -0.29 | -5.03 | 1.01 | 14,880 | 13,980 | 13,426 | 289 |
| PPSP | 2,180 | 0.46 | 1.40 | 0.46 | 2,180 | 2,150 | 18,031 | 157 |
| PAS | 11,900 | 0.00 | 0.51 | 2.94 | 11,900 | 11,640 | 4,817 | 1,021 |
| ABC | 7,320 | 0.27 | -0.27 | -2.92 | 7,400 | 7,180 | 233,532 | 3,171 |
| PEPC | 2,520 | -2.70 | 3.70 | 5.44 | 2,640 | 2,420 | 7,536 | 189 |
| MJQE | 2,120 | 0.47 | 0.47 | 1.92 | 2,120 | 2,090 | 37,990 | 687 |
| CGSM | 2,440 | 0.41 | 0.00 | 0.41 | 2,440 | 2,430 | 41,885 | 4,781 |
| DBDE | 2,100 | 0.00 | 0.48 | 1.94 | 2,110 | 2,060 | 12,302 | 39 |
| JSL | 3,060 | 0.99 | 0.33 | -10.53 | 3,080 | 3,030 | 2,725 | 79 |
| 1D = 1 Day; 1M= 1 Month; MTD = Month-To-Date; YTD = Year-To-Date; Chg = Change; Vol = Volume; shr = share; Mkt cap = Market capitalization | ||||||||
Valuation Ratios
| EPS | BPS* | P/E | P/B | P/S | EV/EBITDA | ||
| ttm,mrq | (ttm,KHR) | KHR | (ttm,x) | (mrq,x) | (ttm,x) | (ttm,x) | |
| PPWSA | 3Q24 | 1,279 | 12,359 | 4.96 | 0.51 | 1.41 | 10.14 |
| GTI | 4Q24 | 48 | 7,057 | 126.25 | 0.86 | 0.72 | 23.06 |
| PPAP | 4Q24 | 2,550 | 22,115 | 5.48 | 0.63 | 1.71 | 3.44 |
| PPSP | 4Q24 | 220 | 3,866 | 9.92 | 0.56 | 2.95 | 5.19 |
| PAS | 4Q24 | 1,478 | 8,224 | 8.05 | 1.45 | 2.22 | 7.96 |
| ABC | 4Q24 | 1,140 | 13,790 | 6.42 | 0.53 | 0.97 | NA |
| PEPC* | 1Q25 | -1,009 | -17 | NA | -146.40 | 4.40 | NA |
| MJQE | 4Q24 | 37 | 307 | 57.11 | 6.91 | 4.19 | 12.71 |
| CGSM | 4Q24 | 52 | 606 | 46.91 | 4.02 | 6.82 | 16.17 |
| JSL | 4Q24 | 14 | 685 | 218.54 | 4.46 | 4.37 | 18.99 |
| DBDE | 4Q24 | 23 | 1,840 | 91.87 | 1.14 | 0.54 | 8.29 |
| NOTE: ttm= trailing-twelve months; mrq = most recent quarter; *FY ending in June, **excluding non-voting shares | |||||||
| Corporate Bonds |
Trading Summary
| Bond Symbol | Trading Vol (Units) | Trading Val (KHR'mn) | Latest Yield | Credit Rating | Bond Feature | Coupon Rate (%) | Days to Maturity |
| ABC32A | 0 | 0.0 | - - | khAA | Subordinated Bond | 8.50% | 2,507 |
| CGSM33A | 0 | 0.0 | - - | KhAAA | Sustainability Bond | SOFR +3% or 5.5% per annum, whichever is higher | 3,169 |
| CIAF28A | 0 | 0.0 | - - | KhAAA | N/A | 6.30% Annually | 1,373 |
| GT27A | 0 | 0.0 | - - | N/A | Plain Bond, Green Bond | 7% per annum | 998 |
| PPSP29A | 0 | 0.0 | - - | KhAAA | Guaranteed Green Bond | Term SOFR + 1.5% | 1,560 |
| RMAC25A | 0 | 0.0 | - - | N/A | Guaranteed Bond | 5.50% Annually | 27 |
| RRC32A | 0 | 0.0 | - - | N/A | Plain Bond | 7% Annually | 2,768 |
| RRGO27A | 0 | 0.0 | - - | KhAAA | Guaranteed Bond | SOFR+3,5% or 5% per annum (take which one is higher) | 1,015 |
| RRGT32B | 0 | 0.0 | - - | KhAAA | Guaranteed Bond | SOFR+3,5% or 5% per annum (take which one is higher) and Year 6 to Year 10: SOFR+3,75% or 5% per annum (take which one is higher) | 2,842 |
| TCT26A | 0 | 0.0 | - - | N/A | Plain Bond | 4.50% Annually | 530 |
| Government Bonds |
Historical Issuance Summary
| 1 Y | 2 Y | 3 Y | 5 Y | 10 Y | |
| Total issuance ('K units) | 204.1 | 312.0 | 85.3 | 10.0 | 0.0 |
| Outstanding (KHR'bn) | 34.0 | 240.0 | 85.3 | 10.0 | 0.0 |
| Issuance ('K units, Latest) | 24.0 | 0.0 | 0.0 | 0.0 | 0.0 |
| Coupon rate (Latest) | 2.80% | 3.20% | 3.80% | 4.75% | 5.25% |
| Successful yield (Latest) | 3.13% | - | - | - | |
| Latest bidding | 23-Jan-25 | 19-Feb-25 | 11-Dec-24 | 45,581 | 45,525 |
| *Total issuance is the accumulated issuance since September 2022; **Outstanding is aggregate principal value of government that remain outstanding; ***Successful yield: mid yields are shown if multiple price auction method was adopted. | |||||
| Stock Charts |
Main Board
Growth Board