Cambodia's trade volume surpasses $5 billion in January 2025
| News Highlights |
Economy and Industry
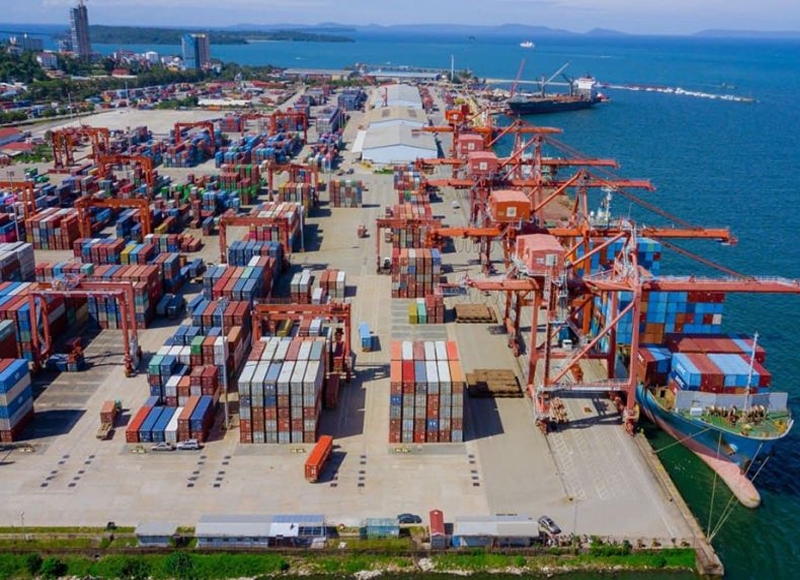
Cambodia's trade volume surpasses $5 billion in January 2025 In January 2025, Cambodia's trade volume exceeded $5 billion, marking a 24.6% increase compared to the same period in 2024. The General Department of Customs and Excise reported that exports totaled over $2.3 billion, reflecting a 17.3% increase, while imports reached $2.7 billion, up by 31.6%. China remains Cambodia's largest trading partner, with a trade volume of approximately $1.5 billion. The United States ranks as the second-largest trading partner, with bilateral trade nearing $900 million. Other significant trading partners include Vietnam, Thailand, and Japan. The growth in trade volume is attributed to the establishment of new factories and enterprises, which require substantial imports in the early stages. (Source: Khmer Times)
Booming gold mining sector generates nearly $90 million in mineral fees Cambodia's gold mining sector has experienced significant growth, generating nearly $90 million in mineral fees. The Ministry of Mines and Energy reported that the sector's robust performance is attributed to the increased extraction and processing of gold ore by several mining companies operating in the country. The ministry highlighted that the revenue from mineral fees has been reinvested into the local economy, supporting infrastructure development and community projects. The government has implemented stringent regulations to ensure sustainable mining practices and minimize environmental impact. The success of the gold mining sector has also attracted foreign investments, further boosting the country's economic growth. (Source: Khmer Times)
Rice exports over 600,000 tonnes achieved in January 2025 In January 2025, Cambodia exported over 600,000 tonnes of rice, generating more than $48 million in revenue. The Cambodian Rice Federation reported that 39 rice exporters shipped the commodity to 45 destinations, including 23 European countries, China, ASEAN nations, and other regions such as Africa, the Middle East, and North America. Fragrant rice accounted for the majority of exports, followed by white rice, parboiled rice, and organic rice. The significant export volume underscores Cambodia's position as a major rice exporter and highlights the country's efforts to improve rice production and quality. The government has been supporting the rice sector through various initiatives, including providing farmers with access to quality seeds, fertilizers, and modern agricultural techniques. (Source: Khmer Times)
Corporate News
PPCBank and Borey Vimean Phnom Penh partner to offer flexible home financing options PPCBank has partnered with Borey Vimean Phnom Penh to provide flexible home financing options for Cambodian homebuyers. The partnership aims to make homeownership more accessible by offering tailored home loan solutions with favorable terms. Customers can finance up to 80% of the property value, with loan repayment terms of up to 30 years. Additionally, PPCBank will cover the property title transfer fee for customers in specific projects. The collaboration is expected to benefit a wide range of customers, including first-time home buyers and those looking to upgrade their properties. The partnership underscores PPCBank's commitment to supporting homeownership and providing innovative financial solutions. Borey Vimean Phnom Penh highlighted the benefits of the collaboration, emphasizing the importance of offering modern, high-quality properties with accessible financing options. (Source: Khmer Times)
Stock Market
CSX index rises 0.18% as PEPC leads gains The CSX index rose by 0.18% to close at 410.5 points. On the main board, PEPC (+3.67%), MJQE (+0.96%), and ABC (+0.28%) led the gains, while PPSP (-0.92%) and PPAP (-0.28%) posted losses. PWSA, GTI, PAS, and CGSM remained unchanged. On the growth board, DBDE and JSL was down 1.43% and 0.65%, respectively. The session recorded a total trading volume of 49,359 shares, with a turnover of KHR 266 million. (Source: YSC Research)
| CSX Stocks |
CSX Index
| Value | 1D % Chg | 1D Vol | Mkt Cap (KHR'bn) |
| 410.54 | 0.18 | 49,359 | 11,011 |
Stock Performance
| Stock | Close (KHR) | 1D chg (%) | MTD chg (%) | YTD chg (%) | 1M high (KHR) | 1M low (KHR) | MTD vol (shr) | Mkt cap (KHR'bn) |
| PWSA | 6,280 | 0.00 | -0.32 | -1.26 | 6,320 | 6,240 | 32,217 | 546 |
| GTI | 6,100 | 0.00 | 14.23 | 20.08 | 6,100 | 5,300 | 65,539 | 244 |
| PPAP | 14,020 | -0.28 | 0.57 | 1.30 | 14,280 | 13,820 | 3,215 | 290 |
| PPSP | 2,150 | -0.92 | -0.46 | -0.92 | 2,170 | 2,130 | 23,043 | 155 |
| PAS | 11,820 | 0.00 | -0.67 | 2.25 | 11,900 | 11,680 | 5,151 | 1,014 |
| ABC | 7,220 | 0.28 | -1.10 | -4.24 | 7,340 | 7,160 | 215,884 | 3,127 |
| PEPC | 2,540 | 3.67 | 7.63 | 6.28 | 2,540 | 2,340 | 3,625 | 190 |
| MJQE | 2,110 | 0.96 | 1.44 | 1.44 | 2,110 | 2,080 | 37,292 | 684 |
| CGSM | 2,430 | 0.00 | -0.41 | 0.00 | 2,450 | 2,420 | 57,750 | 4,761 |
| DBDE | 2,070 | -1.43 | 0.98 | 0.49 | 2,100 | 2,050 | 3,413,368 | 38 |
| JSL | 3,040 | -0.65 | -0.98 | -11.11 | 3,100 | 3,020 | 2,311 | 78 |
| 1D = 1 Day; 1M= 1 Month; MTD = Month-To-Date; YTD = Year-To-Date; Chg = Change; Vol = Volume; shr = share; Mkt cap = Market capitalization | ||||||||
Valuation Ratios
| EPS | BPS* | P/E | P/B | P/S | EV/EBITDA | ||
| ttm,mrq | (ttm,KHR) | KHR | (ttm,x) | (mrq,x) | (ttm,x) | (ttm,x) | |
| PPWSA | 3Q24 | 1,279 | 12,359 | 4.91 | 0.51 | 1.39 | 10.11 |
| GTI | 3Q24 | 91 | 7,114 | 67.40 | 0.86 | 0.71 | 17.89 |
| PPAP | 3Q24 | 2,406 | 21,877 | 5.83 | 0.64 | 1.79 | 3.68 |
| PPSP | 3Q24 | 267 | 3,759 | 8.04 | 0.57 | 2.37 | 4.60 |
| PAS | 3Q24 | 784 | 7,630 | 15.07 | 1.55 | 2.48 | 9.03 |
| ABC | 3Q24 | 1,041 | 13,404 | 6.94 | 0.54 | 0.89 | NA |
| PEPC* | 1Q25 | -1,009 | -17 | NA | -147.57 | 4.44 | NA |
| MJQE | 3Q24 | 41 | 290 | 51.03 | 7.26 | 4.23 | 14.68 |
| CGSM | 3Q24 | 137 | 603 | 17.73 | 4.03 | 6.66 | 14.43 |
| JSL | 3Q24 | 3 | 677 | 1116.55 | 4.49 | 3.36 | 25.80 |
| DBDE | 3Q24 | -340 | 1,510 | NA | 1.37 | 0.58 | NA |
| NOTE: ttm= trailing-twelve months; mrq = most recent quarter; *FY ending in June, **excluding non-voting shares | |||||||
| Corporate Bonds |
Trading Summary
| Bond Symbol | Trading Vol (Units) | Trading Val (KHR'mn) | Latest Yield | Credit Rating | Bond Feature | Coupon Rate (%) | Days to Maturity |
| CGSM33A | 0 | 0.0 | - - | KhAAA | Sustainability Bond | Floating* | 3,193 |
| CIAF28A | 0 | 0.0 | - - | KhAAA | N/A | 6.30% Annually | 1,397 |
| GT27A | 0 | 0.0 | - - | N/A | Plain Bond, Green Bond | 7% per annum | 1,022 |
| PPSP29A | 0 | 0.0 | - - | KhAAA | Guaranteed Green Bond | Term SOFR + 1.5% | 1,584 |
| RMAC25A | 0 | 0.0 | - - | N/A | Guaranteed Bond | 5.50% Annually | 51 |
| RRC32A | 0 | 0.0 | - - | N/A | Plain Bond | 7% Annually | 2,792 |
| RRGO27A | 0 | 0.0 | - - | KhAAA | Guaranteed Bond | Floating** | 1,039 |
| RRGT32B | 0 | 0.0 | - - | KhAAA | Guaranteed Bond | Floating*** | 2,866 |
| TCT26A | 0 | 0.0 | - - | N/A | Plain Bond | 4.50% Annually | 554 |
| TCT28A | 0 | 0.0 | - - | KhAAA | FX-Linked Bond | Floating**** | 1,411 |
| *SOFR +3% or 5.5% per annum, whichever is higher; **SOFR+3,5% or 5% per annum (take which one is higher);***SOFR+3,5% or 5% per annum (take which one is higher) and Year 6 to Year 10: SOFR+3,75% or 5% per annum (take which one is higher);****Term SOFR + 2.5% | |||||||
| Government Bonds |
Historical Issuance Summary
| 1 Y | 2 Y | 3 Y | 5 Y | 10 Y | |
| Total issuance ('K units) | 204.1 | 312.0 | 85.3 | 10.0 | 0.0 |
| Outstanding (KHR'bn) | 34.0 | 312.0 | 85.3 | 10.0 | 0.0 |
| Issuance ('K units, Latest) | 24.0 | 20.0 | 0.0 | 0.0 | 0.0 |
| Coupon rate (Latest) | 2.80% | 4.00% | 3.80% | 4.75% | 5.25% |
| Successful yield (Latest) | 3.13% | 4.00% | - | - | - |
| Latest bidding | 23-Jan-25 | 29-May-24 | 11-Dec-24 | 45,581 | 45,525 |
| *Total issuance is the accumulated issuance since September 2022; **Outstanding is aggregate principal value of government that remain outstanding; ***Successful yield: mid yields are shown if multiple price auction method was adopted. | |||||
| Stock Charts |
Main Board
Growth Board