Cambodia's tourism sector achieves new heights with $3.63 billion revenue
| News Highlights |
Economy and Industry
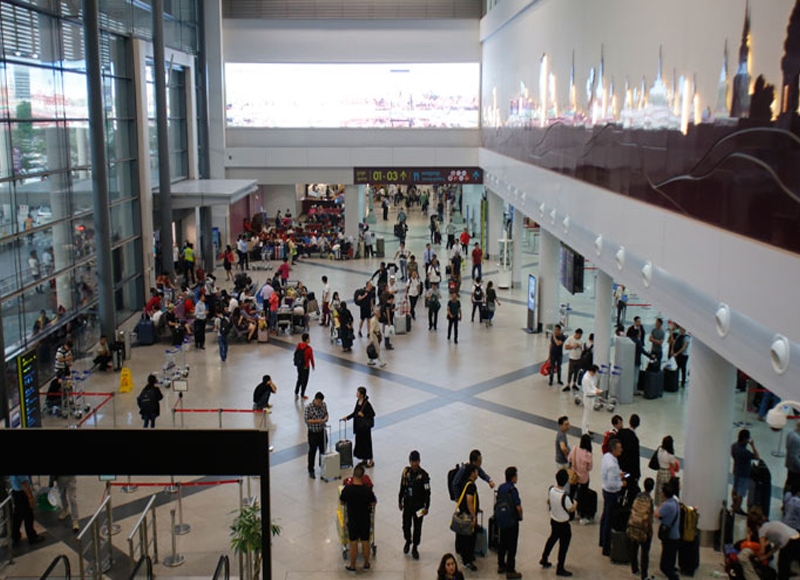
Cambodia's tourism sector achieves new heights with $3.63 billion revenue In 2024, Cambodia's tourism sector reached a significant milestone, generating $3.63 billion in revenue, a 17.8% increase from the previous year's $3.08 billion. The Ministry of Tourism reported that the country welcomed 6.7 million international tourists, a 22.9% rise from 5.45 million in 2023. The top five source markets for tourists were Thailand, Vietnam, China, Laos, and the United States. The sector's growth is attributed to the country's four world heritage sites, including the Angkor Archaeological Park, the Temple Zone of Sambor Prei Kuk, the Temple of Preah Vihear, and the Koh Ker archaeological site. He emphasized the need for restructuring tourism products, improving air connectivity, and launching effective destination marketing campaigns to attract more visitors. (Source: Khmer Times)
Angkor Archaeological Park generates nearly $7 million in January In January 2025, Cambodia's Angkor Archaeological Park earned $6.9 million in revenue from ticket sales, a 25% increase from the same month the previous year. The park received 146,140 international visitors, up 26% from January 2024. The Angkor Archaeological Park, located in Siem Reap province, is home to 91 ancient temples built between the 9th and 13th centuries and is Cambodia's most popular tourist destination. The park is inscribed on the UNESCO World Heritage List. In 2024, the park attracted 1.02 million international tourists, generating $47.8 million in revenue from ticket sales. (Source: Khmer Times)
Cambodia's retail credit surpasses $15 billion Cambodia's retail credit market has seen substantial growth, with the total outstanding credit loan balance surpassing $15 billion by the third quarter of 2024. This growth reflects an increase in both the number of loan accounts and the loan balance. The Credit Bureau Cambodia (CBC) reported a rise in retail credit applications and disbursements, with a positive performance in the number of loan accounts and loan balance. Retail credit quality, measured by the percentage of loan accounts overdue by more than 30 days (30+ DPD), improved slightly from 6.35% in third quarter 2024 to 6.24 last quarter. The CBC's report highlighted a 37% increase in retail credit applications, with personal finance applications growing by 39%, credit card applications by 74%, and mortgage applications by 1%. (Source: Khmer Times)
Corporate News
Paint Labs Jotun studio opens in Cambodia Paint Labs, in collaboration with Jotun, has launched Cambodia's first Jotun Studio, integrating both Decorative and Protective coatings under one roof. The grand opening event, held on January 24, 2025, in Phnom Penh, brought together industry leaders from the construction, design, and business sectors. The Paint Labs Jotun Studio aims to inspire and provide solutions for homeowners and industrial players in Cambodia. The studio offers an interactive setting where customers can explore Jotun's extensive color collections, luxurious finishes, and advanced protective coatings tailored for industrial applications. The launch event featured product demonstrations and discussions on the future of premium paints in Cambodia. (Source: Cambodia Investment Review)
Stock Market
CSX index drops 0.22% as trading volume reaches 44.7k shares The CSX Index declined by 0.22%, closing at 410.0 points. On the main board, PEPC (+0.42%) led the gains, while GTI (-0.75%), ABC (-0.46%), PAS (-0.34%), and PWSA (-0.32%) recorded losses. PPAP, MJQE, and CGSM remained unchanged. On the growth board, DBDE was unchanged, while JSL declined by 0.65%. The session recorded a total trading volume of 44,724 shares, with a turnover of KHR 218 million. (Source: YSC Research)
| CSX Stocks |
CSX Index
| Value | 1D % Chg | 1D Vol | Mkt Cap (KHR'bn) |
| 409.95 | -0.22 | 44,724 | 10,995 |
Stock Performance
| Stock | Close (KHR) | 1D chg (%) | MTD chg (%) | YTD chg (%) | 1M high (KHR) | 1M low (KHR) | MTD vol (shr) | Mkt cap (KHR'bn) |
| PWSA | 6,280 | -0.32 | -0.32 | -1.26 | 6,340 | 6,260 | 5,379 | 546 |
| GTI | 5,300 | -0.75 | -0.75 | 4.33 | 5,360 | 5,040 | 2,511 | 212 |
| PPAP | 13,940 | 0.00 | 0.00 | 0.72 | 14,000 | 13,500 | 155 | 288 |
| PPSP | 2,150 | -0.46 | -0.46 | -0.92 | 2,170 | 2,130 | 5,269 | 155 |
| PAS | 11,860 | -0.34 | -0.34 | 2.60 | 11,900 | 11,620 | 908 | 1,017 |
| ABC | 7,260 | -0.55 | -0.55 | -3.71 | 7,400 | 7,120 | 15,878 | 3,145 |
| PEPC | 2,370 | 0.42 | 0.42 | -0.84 | 2,440 | 2,320 | 137 | 178 |
| MJQE | 2,080 | 0.00 | 0.00 | 0.00 | 2,080 | 2,060 | 10,800 | 674 |
| CGSM | 2,440 | 0.00 | 0.00 | 0.41 | 2,450 | 2,420 | 3,993 | 4,781 |
| DBDE | 2,050 | 0.00 | 0.00 | -0.49 | 2,060 | 2,030 | 179 | 38 |
| JSL | 3,050 | -0.65 | -0.65 | -10.82 | 3,420 | 3,020 | 12 | 78 |
| 1D = 1 Day; 1M= 1 Month; MTD = Month-To-Date; YTD = Year-To-Date; Chg = Change; Vol = Volume; shr = share; Mkt cap = Market capitalization | ||||||||
Valuation Ratios
| EPS | BPS* | P/E | P/B | P/S | EV/EBITDA | ||
| ttm,mrq | (ttm,KHR) | KHR | (ttm,x) | (mrq,x) | (ttm,x) | (ttm,x) | |
| PPWSA | 3Q24 | 1,279 | 12,359 | 4.91 | 0.51 | 1.39 | 10.11 |
| GTI | 3Q24 | 91 | 7,114 | 58.56 | 0.75 | 0.62 | 16.17 |
| PPAP | 3Q24 | 2,406 | 21,877 | 5.79 | 0.64 | 1.78 | 3.66 |
| PPSP | 3Q24 | 267 | 3,759 | 8.04 | 0.57 | 2.37 | 4.60 |
| PAS | 3Q24 | 784 | 7,630 | 15.12 | 1.55 | 2.48 | 9.05 |
| ABC | 3Q24 | 1,041 | 13,404 | 6.98 | 0.54 | 0.90 | NA |
| PEPC* | 1Q25 | -1,009 | -17 | NA | -137.69 | 4.14 | NA |
| MJQE | 3Q24 | 41 | 290 | 50.30 | 7.16 | 4.17 | 14.48 |
| CGSM | 3Q24 | 137 | 603 | 17.80 | 4.04 | 6.69 | 14.48 |
| JSL | 3Q24 | 3 | 677 | 1120.22 | 4.50 | 3.37 | 25.86 |
| DBDE | 3Q24 | -340 | 1,510 | NA | 1.36 | 0.58 | NA |
| NOTE: ttm= trailing-twelve months; mrq = most recent quarter; *FY ending in June, **excluding non-voting shares | |||||||
| Corporate Bonds |
Trading Summary
| Bond Symbol | Trading Vol (Units) | Trading Val (KHR'mn) | Latest Yield | Credit Rating | Bond Feature | Coupon Rate (%) | Days to Maturity |
| CGSM33A | 0 | 0.0 | - - | KhAAA | Sustainability Bond | Floating* | 3,207 |
| CIAF28A | 0 | 0.0 | - - | KhAAA | N/A | 6.30% Annually | 1,411 |
| GT27A | 0 | 0.0 | - - | N/A | Plain Bond, Green Bond | 7% per annum | 1,036 |
| PPSP29A | 0 | 0.0 | - - | KhAAA | Guaranteed Green Bond | Term SOFR + 1.5% | 1,598 |
| RMAC25A | 0 | 0.0 | - - | N/A | Guaranteed Bond | 5.50% Annually | 65 |
| RRC32A | 0 | 0.0 | - - | N/A | Plain Bond | 7% Annually | 2,806 |
| RRGO27A | 0 | 0.0 | - - | KhAAA | Guaranteed Bond | Floating** | 1,053 |
| RRGT32B | 0 | 0.0 | - - | KhAAA | Guaranteed Bond | Floating*** | 2,880 |
| TCT26A | 0 | 0.0 | - - | N/A | Plain Bond | 4.50% Annually | 568 |
| TCT28A | 0 | 0.0 | - - | KhAAA | FX-Linked Bond | Floating**** | 1,425 |
| *SOFR +3% or 5.5% per annum, whichever is higher; **SOFR+3,5% or 5% per annum (take which one is higher);***SOFR+3,5% or 5% per annum (take which one is higher) and Year 6 to Year 10: SOFR+3,75% or 5% per annum (take which one is higher);****Term SOFR + 2.5% | |||||||
| Government Bonds |
Historical Issuance Summary
| 1 Y | 2 Y | 3 Y | 5 Y | 10 Y | |
| Total issuance ('K units) | 204.1 | 312.0 | 85.3 | 10.0 | 0.0 |
| Outstanding (KHR'bn) | 34.0 | 312.0 | 85.3 | 10.0 | 0.0 |
| Issuance ('K units, Latest) | 24.0 | 20.0 | 0.0 | 0.0 | 0.0 |
| Coupon rate (Latest) | 2.80% | 4.00% | 3.80% | 4.75% | 5.25% |
| Successful yield (Latest) | 3.13% | 4.00% | - | - | - |
| Latest bidding | 23-Jan-25 | 29-May-24 | 11-Dec-24 | 45,581 | 45,525 |
| *Total issuance is the accumulated issuance since September 2022; **Outstanding is aggregate principal value of government that remain outstanding; ***Successful yield: mid yields are shown if multiple price auction method was adopted. | |||||
| Stock Charts |
Main Board
Growth Board