Cambodia rises to the position of the world's second-largest producer of raw cashew nuts
| News Highlights |
Economy and Industry
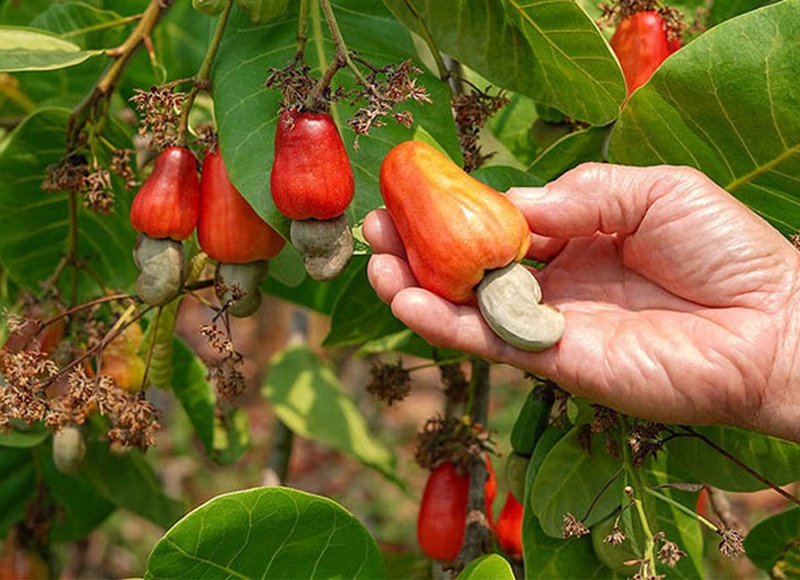
Cambodia rises to the position of the world's second-largest producer of raw cashew nuts Cambodia has emerged as the world's second-largest producer of raw cashew nuts, with a total output of 830,000 tonnes in the first seven months of 2024. This surge in production is largely due to cashew crops adapting well to the El Nino phenomenon, resulting in over 780,000 tonnes exported to Vietnam valued at $1.092 billion. To capitalize on this growth, the Cambodian cashew industry aims to attract more investment in local processing, as outlined in the National Cashew Policy 2022-2027. Currently, dried cashew nuts are priced at approximately 7,300 riel per kilogram. However, to fully realize the policy's goals, Cambodia needs an additional $329 million in investment to develop necessary infrastructure. Kao Thach, Delegate of the Royal Government and CEO of the Agricultural and Rural Development Bank, has encouraged cashew farmers to join the Cambodian Agricultural Cooperatives (CAC) and other farming communities to enhance cashew nut production, quality, and market reach. (Source: Khmer Times)
Retail credit expands as small business lending contracts in Q2 2024 Cambodia's credit market displayed mixed trends in Q2 2024, with retail credit growing while small business lending declined. Retail credit accounts increased by 4.75% to nearly 1.92 million, and outstanding loan balances rose by 0.67% to $15.31 billion. This growth was largely driven by an uptick in mortgage and credit card applications, although personal finance applications fell by 2%. Despite the growth, the quality of retail loans declined, with the ratio of loans 30 days or more past due rising from 6.03% in Q1 to 6.22% in Q2. In contrast, small business lending contracted, with the number of loan accounts dropping by 1.7%, and the overall loan balance seeing only a slight increase of 0.1% to $34.22 billion. Notably, regional disparities in credit performance emerged, with the plateau region experiencing the sharpest decline in construction loan applications. (Source: Phnom Penh Post)
SCC, SCVC, and G-1% Club sign an MoU to broaden their business collaboration Singapore Club Cambodia (SCC) has entered into a Memorandum of Understanding (MoU) with the Singapore Cambodia Venture Club (SCVC) and the Global Entrepreneur 1% Club (G-1% Club) to enhance collaboration and expand business opportunities. The MoU outlines joint efforts to promote business, social, and professional networking, explore trade opportunities, and support cross-border investments among the member organizations. The signing ceremony was attended by Ying Sarath, Secretary of State and Advisor to the Royal Government of Cambodia, and Bernice Seow, Second Secretary (Political) from the Embassy of the Republic of Singapore in Phnom Penh. The event drew over 100 guests, including more than a dozen Singaporean entrepreneurs interested in potential investments in Cambodia. This MoU underscores a shared commitment to mutual growth and development, with the goal of leveraging each organization's strengths to drive economic progress and enhance business opportunities across borders. (Source: Khmer Times)
Corporate News
PAS earns more than $52 million in revenue during the first half of 2024 Cambodia's largest port, Sihanoukville Autonomous Port (PAS), reported a 25% revenue increase in the first half of 2024, generating $52 million, up by over $10 million from the same period in 2023. The port's total assets grew by 5.29% YoY to $420 million, while its total equity rose by 5.69% YoY to exceed $250 million. This growth is driven by Cambodia's strong economic performance, a resurgence in tourism, and a thriving garment manufacturing sector, which have boosted import and export activities. Additionally, the completion of a new container terminal has enhanced the port's capacity to handle larger vessels and greater cargo volumes. As Cambodia's sole international and commercial deep seaport, PAS is set to continue its expansion in three phases, reinforcing its role as a key driver of the nation's trade and economic development. (Source: Khmer Times)
Stock Market
CSX index falls 0.63% as market sees mixed performance on August 19, 2024 On August 19, 2024, the CSX Index closed at 411.3 points, marking a 0.63% decline from the previous day. Despite this overall dip, PEPC (+0.83%) and GTI (+0.27%) posted gains, while PWSA (-2.29%), PAS (-0.88%), ABC (-0.53%), MJQE (-0.49%), CGSM (-0.41%), and PPAP (-0.41%) experienced losses. On the growth board, DBDE and JSL remained unchanged. The day's total trading volume was 95,491 shares, with a cumulative trading value of KHR 470 million. (Source: YSC Research)
| CSX Stocks |
CSX Index
| Value | 1D % Chg | 1D Vol | Mkt Cap (KHR'bn) |
| 411.27 | -0.63 | 95,491 | 11,031 |
Stock Performance
| Stock | Close (KHR) | 1D chg (%) | MTD chg (%) | YTD chg (%) | 1M high (KHR) | 1M low (KHR) | MTD vol (shr) | Mkt cap (KHR'bn) |
| PWSA | 6,820 | -2.29 | -2.57 | -6.32 | 7,060 | 6,820 | 57,314 | 593 |
| GTI | 3,650 | 0.27 | -3.95 | 28.52 | 3,800 | 3,370 | 518,733 | 146 |
| PPAP | 14,520 | -0.41 | -0.55 | 3.71 | 15,400 | 14,440 | 10,534 | 300 |
| PPSP | 2,260 | -0.88 | -1.31 | 3.67 | 2,360 | 2,250 | 463,459 | 162 |
| PAS | 11,800 | -1.50 | -2.16 | -6.20 | 12,160 | 11,800 | 14,747 | 1,012 |
| ABC | 7,460 | -0.53 | -0.53 | -25.84 | 7,540 | 7,440 | 464,705 | 3,231 |
| PEPC | 2,440 | 0.83 | -1.21 | -10.95 | 2,520 | 2,410 | 6,980 | 183 |
| MJQE | 2,040 | -0.49 | -0.49 | -4.23 | 2,060 | 2,040 | 73,661 | 661 |
| CGSM | 2,420 | -0.41 | 0.00 | -7.98 | 2,440 | 2,400 | 98,834 | 4,741 |
| DBDE | 2,080 | 0.00 | -0.48 | -2.80 | 2,100 | 2,080 | 29,587 | 38 |
| JSL | 3,460 | 0.00 | -1.14 | -21.36 | 3,850 | 3,410 | 49,483 | 89 |
| 1D = 1 Day; 1M= 1 Month; MTD = Month-To-Date; YTD = Year-To-Date; Chg = Change; Vol = Volume; shr = share; Mkt cap = Market capitalization | ||||||||
Valuation Ratios
| EPS | BPS* | P/E | P/B | P/S | EV/EBITDA | ||
| ttm,mrq | (ttm,KHR) | KHR | (ttm,x) | (mrq,x) | (ttm,x) | (ttm,x) | |
| PPWSA | 1Q24 | 1,298 | 16,580 | 5.25 | 0.41 | 1.55 | 9.87 |
| GTI | 1Q24 | 106 | 7,068 | 34.32 | 0.52 | 0.44 | 13.62 |
| PPAP | 1Q24 | 1,952 | 38,178 | 7.44 | 0.38 | 2.15 | 5.16 |
| PPSP | 1Q24 | 445 | 3,501 | 5.08 | 0.65 | 1.18 | 5.54 |
| PAS | 1Q24 | 1,803 | 11,721 | 6.54 | 1.01 | 2.93 | 5.61 |
| ABC | 1Q24 | 1,518 | 13,222 | 4.91 | 0.56 | 0.96 | NA |
| PEPC* | 4Q23 | -477 | 842 | NA | 2.90 | 4.28 | 65.53 |
| MJQE | 4Q23 | 59 | 297 | 34.65 | 6.88 | 4.42 | 13.68 |
| CGSM | 4Q23 | 166 | 563 | 14.57 | 4.30 | 6.34 | 15.30 |
| JSL | 4Q23 | 274 | 593 | 12.62 | 5.83 | 1.29 | NA |
| DBDE | 1Q24 | 250 | 1,930 | 8.33 | 1.08 | 0.49 | 5.62 |
| NOTE: ttm= trailing-twelve months; mrq = most recent quarter; *FY ending in June | |||||||
| Corporate Bonds |
Trading Summary
| Bond Symbol | Trading Vol (Units) | Trading Val (KHR'mn) | Latest Yield | Credit Rating | Bond Feature | Coupon Rate (%) | Days to Maturity |
| CGSM33A | 0 | 0.0 | - - | KhAAA | Sustainability | Floating* | 3,375 |
| CIAF28A | 0 | 0.0 | - - | KhAAA | N/A | 6.30% | 1,579 |
| GT27A | 0 | 0.0 | - - | N/A | Plain , Green | 7.00% | 1,204 |
| PPSP29A | 0 | 0.0 | - - | KhAAA | Guaranteed Green | Term SOFR + 1.5% | 1,766 |
| RMAC25A | 0 | 0.0 | - - | N/A | Guaranteed | 5.50% | 233 |
| RRC32A | 0 | 0.0 | - - | N/A | Plain | 7.00% | 2,974 |
| RRGO27A | 0 | 0.0 | - - | KhAAA | Guaranteed | Floating** | 1,221 |
| RRGT32B | 0 | 0.0 | - - | KhAAA | Guaranteed | Floating*** | 3,048 |
| TCT26A | 0 | 0.0 | - - | N/A | Plain | 4.50% | 736 |
| TCT28A | 0 | 0.0 | - - | KhAAA | FX-Linked | Floating**** | 1,593 |
| *SOFR +3% or 5.5% , whichever is higher; **SOFR+3,5% or 5% (take which one is higher);***SOFR+3,5% or 5% (take which one is higher) and Year 6 to Year 10: SOFR+3,75% or 5% (take which one is higher);****Term SOFR + 2.5% | |||||||
| Government Bonds |
Historical Issuance Summary
| 1 Y | 2 Y | 3 Y | 5 Y | 10 Y | |
| Total issuance ('K units) | 180.1 | 312.0 | 65.3 | 10.0 | - |
| Outstanding (KHR'bn) | 52.0 | 312.0 | 65.3 | 10.0 | - |
| Issuance ('K units, Latest) | 10.0 | 20.0 | 43.3 | 10.0 | - |
| Coupon rate (Latest) | 3.50% | 4.00% | 4.50% | 5.00% | - |
| Successful yield (Latest) | 3.85% | 4.00% | 4.63% | 5.00% | - |
| Latest bidding | 24-Apr-24 | 29-May-24 | 26-Jun-24 | 45,497 | - |
| *Total issuance is the accumulated issuance since September 2022; **Outstanding is aggregate principal value of government that remain outstanding; ***Successful yield: mid yields are shown if multiple price auction method was adopted. | |||||
| Stock Charts |
Main Board
Growth Board