Cambodia's exports surpass $20 billion, rising 14.8% in the first eight months of 2025
| News Highlights |
Economy and Industry
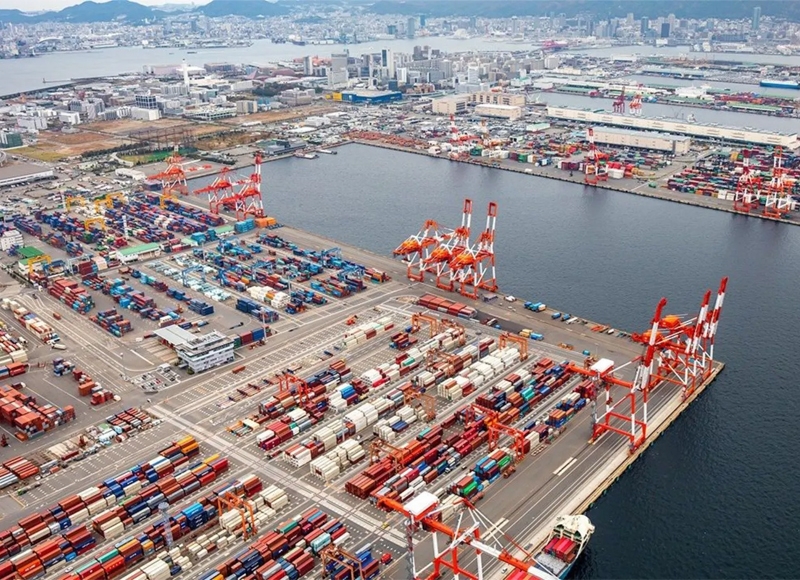
Cambodia's exports surpass $20 billion, rising 14.8% in the first eight months of 2025 In the first eight months of 2025, Cambodia's exports reached $20.18 billion, a 14.8% increase from the previous year, with major goods including apparel, footwear, travel items, bicycles, car tires, and agricultural products. The primary export destinations were the United States, Vietnam, China, Japan, and Canada. During the same period, imports totaled $21.96 billion, up 16.2% year-on-year, comprising oil, gas, raw materials for garments, vehicles, and electronics. Trade growth has been influenced by the Regional Comprehensive Economic Partnership (RCEP) agreement and the Cambodia-China Free Trade Agreement. (Source: Khmer Times)
Five business deals signed during Marcos Jr's visit to Cambodia Philippine President Ferdinand R. Marcos Jr. reported the signing of three Memoranda of Understanding (MoU) and five business deals between the Philippines and Cambodia following his three-day state visit. These agreements, involving the private sectors of both nations, were focused on sectors including aviation, logistics, and women-led micro, small and medium enterprises. Marcos Jr. noted that these business deals aim to foster strategic partnerships, explore market opportunities for Philippine exports, and strengthen institutional ties between the business associations of both countries. The visit included constructive exchanges with Cambodian Acting Head of State Hun Sen and Prime Minister Hun Manet, emphasizing bilateral and multilateral cooperation. (Source: Khmer Times)
Phnom Penh's Challenge: Affordable Housing for Everyone A report by Sahmakum Teang Tnaut (STT) indicates that approximately 70% of Phnom Penh residents cannot afford a home, forcing many into informal settlements or reliant on installment plans. The city is projected to need 1.1 million additional homes by 2030, exacerbating the affordability gap. While Knight Frank reported 93,573 units in 2024, new unit growth slowed. Mid-tier homes saw the most development, but units under $200,000, though in high demand, remain unaffordable for many. Mortgage applications in Cambodia rose 9% in Q1 2025, with total loans reaching $15.9 billion. STT recommends that the government and financial institutions strengthen long-term, low-interest home loans for low-income families. A government plan introduced in January aims to help buyers transfer high-interest debts to banks for lower rates. As of 2024, four affordable housing developers were constructing 11,495 houses. (Source: Kiripost)
Corporate News
Chinese bank vows increased investment in Cambodia Chinese companies view Cambodia as a strategic platform to reach broader markets, attracted by its free trade agreements. The Export-Import Bank of China (CEXIM) is committed to increasing Chinese investment, supporting key projects like the Funan Techo Canal and the Sihanoukville Special Economic Zone (SSEZ) to enhance Cambodia's logistics and manufacturing capabilities. CEXIM has significantly contributed to Cambodia's infrastructure development. Cambodia's liberal investment regime, coupled with agreements such as the Cambodia-China Free Trade Agreement (CCFTA) and RCEP, positions it as an attractive regional hub, drawing substantial Chinese capital and driving the Kingdom's industrialization and economic growth. (Source: Khmer Times)
Stock Market
CSX gains marginally as PEPC leads advances On 11 September 2025, the CSX Index rose 0.10% to close at 404.0 points. On the Main Board, PEPC (+1.55%) and ABC (+0.30%) posted gains, while GTI (-0.28%) recorded losses. PWSA, PPAP, PPSP, PAS, MJQE, and CGSM all closed unchanged. On the Growth Board, DBDE closed unchanged, while JSL dropped 4.48%. Total trading volume reached 22,892 shares, with a turnover of KHR 132 million. (Source: YSC Research)
| CSX Stocks |
CSX Index
| Value | 1D % Chg | 1D Vol | Mkt Cap (KHR'bn) |
| 404 | 0.10 | 22,892 | 10,836 |
Stock Performance
| Stock | Close (KHR) | 1D chg (%) | MTD chg (%) | YTD chg (%) | 1M high (KHR) | 1M low (KHR) | MTD vol (shr) | Mkt cap (KHR'bn) |
| PWSA | 6,220 | 0.00 | -0.32 | -2.20 | 6,260 | 6,200 | 23,853 | 541 |
| GTI | 7,000 | -0.28 | -2.23 | 37.80 | 7,180 | 6,960 | 18,300 | 280 |
| PPAP | 13,600 | 0.00 | -0.29 | -1.73 | 13,700 | 13,500 | 2,687 | 281 |
| PPSP | 2,070 | 0.00 | 0.98 | -4.61 | 2,070 | 2,050 | 144,282 | 149 |
| PAS | 12,100 | 0.00 | 0.83 | 4.67 | 12,140 | 11,920 | 3,944 | 1,038 |
| ABC | 6,760 | 0.30 | -0.29 | -10.34 | 6,860 | 6,740 | 146,237 | 2,928 |
| PEPC | 2,620 | 1.55 | 0.77 | 9.62 | 2,670 | 2,510 | 2,591 | 196 |
| MJQE | 1,980 | 0.00 | -0.50 | -4.81 | 2,000 | 1,980 | 52,417 | 642 |
| CGSM | 2,440 | 0.00 | -0.81 | 0.41 | 2,460 | 2,420 | 59,655 | 4,781 |
| DBDE | 2,030 | 0.00 | -0.49 | -1.46 | 2,050 | 2,000 | 3,540 | 37 |
| JSL | 2,770 | -4.48 | -0.36 | -19.01 | 2,900 | 2,760 | 2,057 | 71 |
| 1D = 1 Day; 1M= 1 Month; MTD = Month-To-Date; YTD = Year-To-Date; Chg = Change; Vol = Volume; shr = share; Mkt cap = Market capitalization | ||||||||
Valuation Ratios
| EPS | BPS* | P/E | P/B | P/S | EV/EBITDA | ||
| ttm,mrq | (ttm,KHR) | KHR | (ttm,x) | (mrq,x) | (ttm,x) | (ttm,x) | |
| PPWSA | 2Q25 | 827 | 11,622 | 7.52 | 0.54 | 1.70 | 14.89 |
| GTI | 2Q25 | 29 | 7,023 | 240.22 | 1.00 | 0.85 | 39.52 |
| PPAP | 1Q25 | 2,951 | 22,115 | 4.61 | 0.61 | 1.58 | 3.97 |
| PPSP | 2Q25 | 735 | 4,376 | 2.82 | 0.47 | 0.95 | 2.09 |
| PAS | 1Q25 | 1,212 | 8,224 | 9.98 | 1.47 | 2.18 | 7.67 |
| ABC | 2Q25 | 1,460 | 14,410 | 4.63 | 0.47 | 0.81 | NA |
| PEPC* | 3Q25 | -1,445 | -1,303 | NA | NA | 3.14 | NA |
| MJQE | 2Q25 | 45 | 340 | 43.83 | 5.82 | 3.87 | 12.70 |
| CGSM | 2Q25 | 25 | 618 | 99.32 | 3.95 | 6.97 | 19.35 |
| JSL | 2Q25 | -82 | 492 | NA | 5.63 | 20.50 | 34.29 |
| DBDE | 2Q25 | 147 | 1,933 | 13.85 | 1.05 | 0.31 | 7.19 |
| NOTE: ttm= trailing-twelve months; mrq = most recent quarter; *FY ending in June, **excluding non-voting shares | |||||||
| Corporate Bonds |
Trading Summary
| Bond Symbol | Trading Vol (Units) | Trading Val (KHR'mn) | Latest Yield | Credit Rating | Bond Feature | Coupon Rate (%) | Days to Maturity |
| ABC32A | 0 | 0.0 | - - | khAA | Subordinated Bond | 8.50% | 2,325 |
| ABC32B | 0 | 0.0 | - - | KhAA | Subordinated Bond | 8.50% | 2,367 |
| CGSM33A | 0 | 0.0 | - - | KhAAA | Sustainability Bond | SOFR +3% or 5.5% per annum, whichever is higher | 2,987 |
| CIAF28A | 0 | 0.0 | - - | KhAAA | N/A | 6.30% Annually | 1,191 |
| CIAF30A | 0 | 0.0 | - - | KhAAA | Guaranteed Bond | 5.60% | 1,638 |
| GT27A | 0 | 0.0 | - - | N/A | Plain Bond, Green Bond | 7% per annum | 816 |
| PPSP29A | 0 | 0.0 | - - | KhAAA | Guaranteed Green Bond | Term SOFR + 1.5% | 1,378 |
| RRC32A | 0 | 0.0 | - - | N/A | Plain Bond | 7% Annually | 2,586 |
| RRGO27A | 0 | 0.0 | - - | KhAAA | Guaranteed Bond | SOFR+3,5% or 5% per annum (take which one is higher) | 833 |
| RRGT32B | 0 | 0.0 | - - | KhAAA | Guaranteed Bond | SOFR+3,5% or 5% per annum (take which one is higher) and Year 6 to Year 10: SOFR+3,75% or 5% per annum (take which one is higher) | 2,660 |
| SNTD40A | 0 | 0.0 | - - | N/A | Green Infrastructure Bond | 180-Day SOFR Average + 1.80% | 5,312 |
| SNTD40B | 0 | 0.0 | - - | N/A | Green Infrastructure Bond | 180-Day Average SOFR + 1.60% (4.00% - 6.00%) | 5,312 |
| SNTD40C | 0 | 0.0 | - - | N/A | Green Infrastructure Bond | 180-Day SOFR Average + 3.00% | 5,312 |
| Government Bonds |
Historical Issuance Summary
| 1 Y | 2 Y | 3 Y | 5 Y | 10 Y | |
| Total issuance ('K units) | 238.1 | 312.0 | 187.3 | 18.0 | 0.0 |
| Outstanding (KHR'bn) | 58.0 | 208.0 | 187.3 | 18.0 | 0.0 |
| Issuance ('K units, Latest) | 34.0 | 0.0 | 12.0 | 8.0 | 0.0 |
| Coupon rate (Latest) | 2.70% | 3.20% | 3.50% | 4.34% | 4.60% |
| Successful yield (Latest) | 3.25% | - | 3.50% | 5.00% | - |
| Latest bidding | 23-Apr-25 | 21-May-25 | 25-Jun-25 | 45,861 | 45,889 |
| *Total issuance is the accumulated issuance since September 2022; **Outstanding is aggregate principal value of government that remain outstanding; ***Successful yield: mid yields are shown if multiple price auction method was adopted. | |||||
| Stock Charts |
Main Board
Growth Board