Automotive tyre exports record 76% growth
| News Highlights |
Economy and Industry
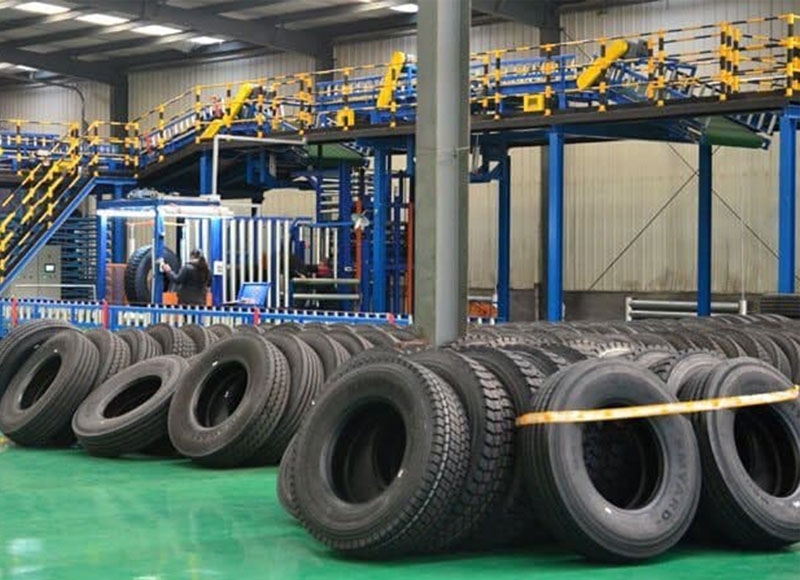
Automotive tyre exports record 76% growth Cambodia has seen a significant increase in car tyre exports in the first four months of 2025, thanks to the country's successful export promotion efforts. Between January and April, Cambodia exported car tyres worth $437 million, a 76% increase from the previous year. The Ministry of Commerce Secretary of State, Penn Sovicheat, attributed this growth to the country's diversification of products and the government's efforts to promote and expand exports to regional and global markets. The government is streamlining business procedures and enhancing the investment climate to attract investors. The growth in vehicle tyre exports is attributed to the establishment of production facilities by international manufacturers, as many tyre manufacturers continue to invest and expand their operations in Cambodia. There are currently six car tyre manufacturing projects in different special economic zones in Cambodia. As of the end of 2024, Cambodia had a total rubber area of over 420,000 hectares, with 330,000 hectares, equivalent to over 77% of the total rubber area, being harvested. (Source: Khmer Times)
Credit growth concentrated in plains region as coastal and plateau regions experience slowdown Cambodia's credit market in 2024 was primarily concentrated in the Plains Region, with the Plains Region accounting for 70.96% of total outstanding loans valued at $36.24 billion. The country's total outstanding loan balance reached $51.06 billion by the end of 2024, a 3.30% increase from the previous year. The Tonle Sap region ranked second, with a 19.68% share or $10.05 billion, with a moderate 1.55% growth. The Coastal Region saw a 2.32% contraction in its loan balance, while the Plateau Region grew by 3.77 percent to reach $2.02 billion. Despite regional differences, financial institutions were relatively well-distributed nationwide. Credit quality, a key measure of the credit market, rose QoQ in 2024, with mortgages reporting the lowest 30+ DPD ratio, reflecting greater credit risk in that segment. (Source: Khmer Times)
Decline in bank asset quality highlighted in latest World Bank report The Cambodian banking system has experienced a sharp decline in asset quality, with the NPL ratio rising to 7.9% in December 2024 from 1.8% in 2019. This deterioration stems from the expiration of COVID-related regulatory forbearance, economic slowdown, the end of the real estate boom, and weak lending standards. NPLs are concentrated in certain sectors, while real estate shows relatively low reported NPLs. The National Bank of Cambodia (NBC) has responded with measures such as the Prakas on Loan Restructuring, which allows banks to restructure loans without reclassification or added provisions. However, NPL resolution remains challenging due to underdeveloped legal frameworks, lengthy court processes, and the absence of an NPL market. A more holistic approach could help - streamlining collateral enforcement, updating bankruptcy laws, introducing willful defaulter rules, refining write-off criteria, regulating debt collection firms, and strengthening macroprudential oversight. (Source: Khmer Times)
Corporate News
DFDL Myanmar advises Cambodian business delegation on legal and tax aspects of market entry amid growing interest in distressed M&A Myanmar's legal and tax frameworks are drawing foreign investors, especially through distressed asset acquisitions. Its strategic location and tax incentives - such as 100% foreign ownership under the Companies Law (2017), MIC and SEZ tax holidays, duty exemptions, and land leases - are restoring investor confidence. Post-2021 exits by global brands have created opportunities for discounted M&A deals with high turnaround potential. With proper due diligence and escrow structures to navigate FX and regulatory hurdles, Myanmar offers first-mover advantages and long-term asset appreciation in Southeast Asia's frontier markets. However, DFDL advises careful investment structuring and close compliance with evolving rules. (Source: Cambodia Investment Review)
Stock Market
Market gains led by GTI and PWSA; no decliners on main board On 13 June 2025, the CSX Index rose by 0.35%, closing at 409.4 points. On the Main Board, GTI (+3.75%), PWSA (+1.26%), PAS (+0.83%), PEPC (+0.74%), PPSP (+0.47%), ABC (+0.29%), and PPAP (+0.15%) were the gainers, while no stocks recorded losses. MJQE and CGSM remained unchanged. On the Growth Board, DBDE remained unchanged and JSL was up by 0.36%. Total trading volume reached 219,312 shares, with a turnover of KHR 1,462 million. (Source: YSC Research)
| CSX Stocks |
CSX Index
| Value | 1D % Chg | 1D Vol | Mkt Cap (KHR'bn) |
| 409.43 | 0.35 | 219,312 | 10,982 |
Stock Performance
| Stock | Close (KHR) | 1D chg (%) | MTD chg (%) | YTD chg (%) | 1M high (KHR) | 1M low (KHR) | MTD vol (shr) | Mkt cap (KHR'bn) |
| PWSA | 6,420 | 1.26 | 1.58 | 0.94 | 6,420 | 6,300 | 44,003 | 558 |
| GTI | 8,300 | 3.75 | 3.49 | 63.39 | 8,300 | 7,760 | 208,378 | 332 |
| PPAP | 13,400 | 0.15 | 0.00 | -3.18 | 13,940 | 13,340 | 4,397 | 277 |
| PPSP | 2,130 | 0.47 | 0.47 | -1.84 | 2,160 | 2,090 | 61,250 | 153 |
| PAS | 12,180 | 0.83 | 1.67 | 5.36 | 12,220 | 11,780 | 7,162 | 1,045 |
| ABC | 6,920 | 0.29 | 0.00 | -8.22 | 6,960 | 6,880 | 279,552 | 2,997 |
| PEPC | 2,710 | 0.74 | -0.73 | 13.39 | 2,790 | 2,600 | 4,765 | 203 |
| MJQE | 2,020 | 0.00 | 0.00 | -2.88 | 2,030 | 2,010 | 71,755 | 655 |
| CGSM | 2,430 | 0.00 | 0.00 | 0.00 | 2,450 | 2,410 | 44,772 | 4,761 |
| DBDE | 2,050 | 0.00 | -5.53 | -0.49 | 2,170 | 2,040 | 41,620 | 38 |
| JSL | 2,800 | 0.36 | 1.82 | -18.13 | 2,880 | 2,600 | 11,794 | 72 |
| 1D = 1 Day; 1M= 1 Month; MTD = Month-To-Date; YTD = Year-To-Date; Chg = Change; Vol = Volume; shr = share; Mkt cap = Market capitalization | ||||||||
Valuation Ratios
| EPS | BPS* | P/E | P/B | P/S | EV/EBITDA | ||
| ttm,mrq | (ttm,KHR) | KHR | (ttm,x) | (mrq,x) | (ttm,x) | (ttm,x) | |
| PPWSA | 4Q24 | 978 | 11,199 | 6.57 | 0.57 | 1.76 | 13.29 |
| GTI | 4Q24 | 48 | 7,057 | 172.92 | 1.18 | 0.99 | 29.31 |
| PPAP | 4Q24 | 2,550 | 22,115 | 5.25 | 0.61 | 1.64 | 3.30 |
| PPSP | 4Q24 | 220 | 3,866 | 9.70 | 0.55 | 2.88 | 5.08 |
| PAS | 4Q24 | 1,478 | 8,224 | 8.24 | 1.48 | 2.27 | 8.09 |
| ABC | 4Q24 | 1,140 | 13,790 | 6.07 | 0.50 | 0.92 | NA |
| PEPC* | 1Q25 | -1,009 | -17 | NA | -157.44 | 4.74 | NA |
| MJQE | 4Q24 | 37 | 307 | 54.41 | 6.58 | 3.99 | 12.14 |
| CGSM | 4Q24 | 52 | 606 | 46.71 | 4.01 | 6.79 | 16.11 |
| JSL | 4Q24 | 14 | 685 | 199.97 | 4.09 | 4.00 | 18.05 |
| DBDE | 4Q24 | 23 | 1,840 | 89.68 | 1.11 | 0.53 | 8.12 |
| NOTE: ttm= trailing-twelve months; mrq = most recent quarter; *FY ending in June, **excluding non-voting shares | |||||||
| Corporate Bonds |
Trading Summary
| Bond Symbol | Trading Vol (Units) | Trading Val (KHR'mn) | Latest Yield | Credit Rating | Bond Feature | Coupon Rate (%) | Days to Maturity |
| ABC32A | 0 | 0.0 | - - | khAA | Subordinated Bond | 8.50% | 2,415 |
| ABC32B | 0 | 0.0 | - - | KhAA | Subordinated Bond | 8.50% | 2,457 |
| CGSM33A | 0 | 0.0 | - - | KhAAA | Sustainability Bond | SOFR +3% or 5.5% per annum, whichever is higher | 3,077 |
| CIAF28A | 0 | 0.0 | - - | KhAAA | N/A | 6.30% Annually | 1,281 |
| CIAF30A | 0 | 0.0 | - - | KhAAA | Guaranteed Bond | 5.60% | 1,728 |
| GT27A | 0 | 0.0 | - - | N/A | Plain Bond, Green Bond | 7% per annum | 906 |
| PPSP29A | 0 | 0.0 | - - | KhAAA | Guaranteed Green Bond | Term SOFR + 1.5% | 1,468 |
| RRC32A | 0 | 0.0 | - - | N/A | Plain Bond | 7% Annually | 2,676 |
| RRGO27A | 0 | 0.0 | - - | KhAAA | Guaranteed Bond | SOFR+3,5% or 5% per annum (take which one is higher) | 923 |
| RRGT32B | 0 | 0.0 | - - | KhAAA | Guaranteed Bond | SOFR+3,5% or 5% per annum (take which one is higher) and Year 6 to Year 10: SOFR+3,75% or 5% per annum (take which one is higher) | 2,750 |
| SNTD40A | 0 | 0.0 | - - | N/A | Green Infrastructure Bond | 180-Day SOFR Average + 1.80% | 5,402 |
| SNTD40B | 0 | 0.0 | - - | N/A | Green Infrastructure Bond | 180-Day Average SOFR + 1.60% (4.00% - 6.00%) | 5,402 |
| SNTD40C | 0 | 0.0 | - - | N/A | Green Infrastructure Bond | 180-Day SOFR Average + 3.00% | 5,402 |
| Government Bonds |
Historical Issuance Summary
| 1 Y | 2 Y | 3 Y | 5 Y | 10 Y | |
| Total issuance ('K units) | 238.1 | 312.0 | 175.3 | 10.0 | 0.0 |
| Outstanding (KHR'bn) | 58.0 | 236.0 | 175.3 | 10.0 | 0.0 |
| Issuance ('K units, Latest) | 34.0 | 0.0 | 90.0 | 0.0 | 0.0 |
| Coupon rate (Latest) | 2.70% | 3.20% | 3.50% | 4.75% | 5.25% |
| Successful yield (Latest) | 3.25% | - | 4.25% | - | - |
| Latest bidding | 23-Apr-25 | 21-May-25 | 19-Mar-25 | 45,581 | 45,525 |
| *Total issuance is the accumulated issuance since September 2022; **Outstanding is aggregate principal value of government that remain outstanding; ***Successful yield: mid yields are shown if multiple price auction method was adopted. | |||||
| Stock Charts |
Main Board
Growth Board